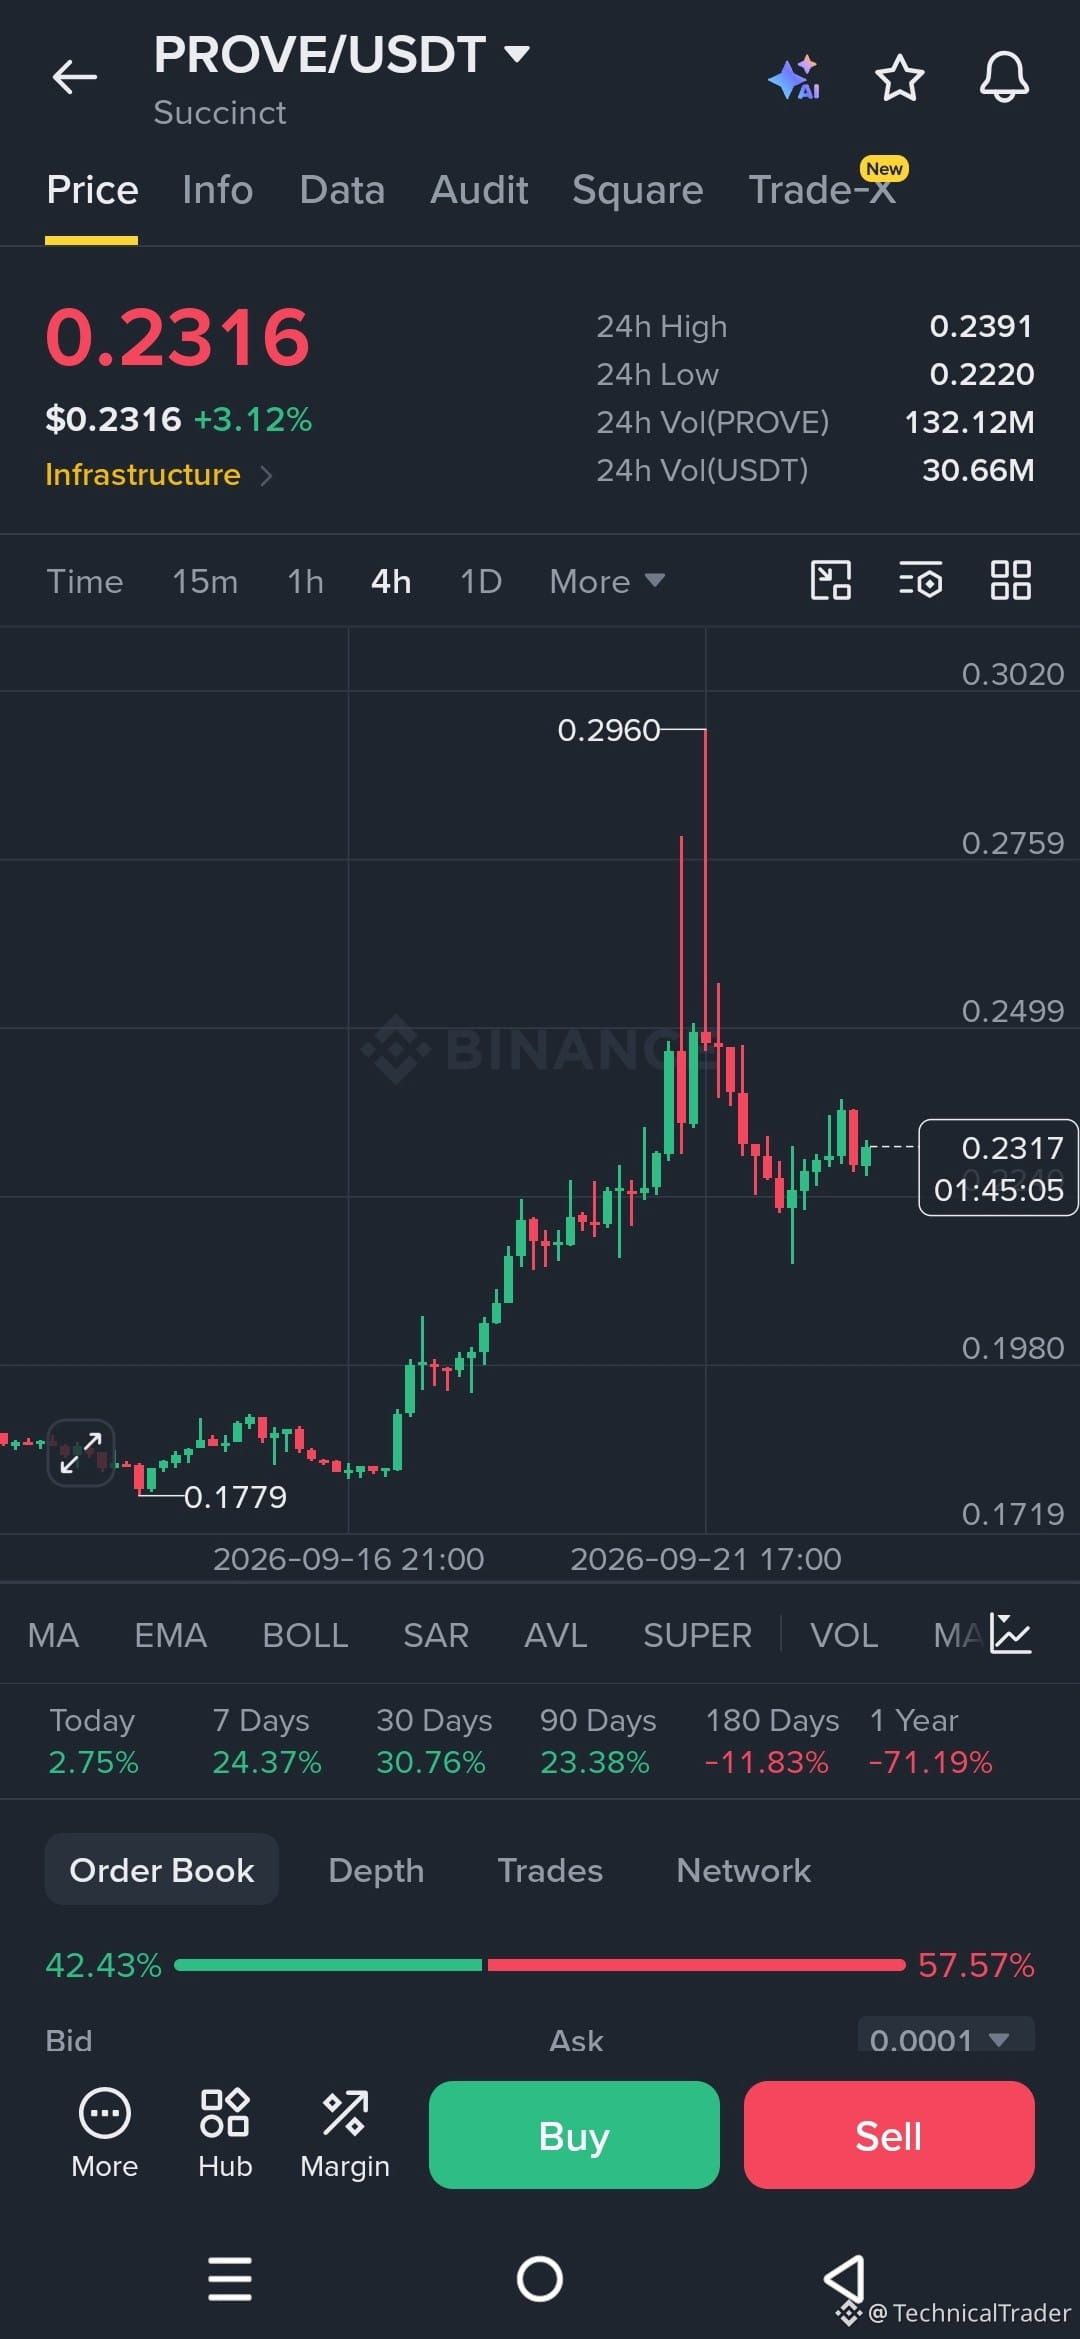
$PROVE is sitting at a level where the next move could get interesting 👀 after the huge push to 0.2960, price was sharply rejected and has now pulled back into the 0.22–0.24 area.
On the 4H chart, the bigger visible structure is still bullish from the 0.1779 low, with price making a strong series of higher highs and higher lows. But after the rejection from 0.2960, momentum cooled down and we’re currently seeing consolidation around 0.23.
The first important resistance is around 0.2499. A strong 4H break and hold above this area could open the way toward 0.2759, followed by the previous high near 0.2960. Above that, the chart shows 0.3020 as the next visible level.
On the downside, 0.2220–0.2160 is the key support zone to watch. Losing this area could expose 0.1980, while a deeper breakdown could bring the previous 0.1779 low back into focus.
Bullish scenario: reclaiming and holding above 0.2499 → possible targets 0.2759 / 0.2960 / 0.3020.
Bearish scenario: losing 0.2220–0.2160 → possible downside toward 0.1980, with 0.1779 as a deeper level.
For a chart-based setup, a breakout entry could be considered around 0.2500, with SL around 0.2310 and targets 0.2759, 0.2960 and 0.3020. These are levels derived only from the visible chart, not a prediction.
Right now, I’m watching whether price can reclaim 0.2499 or instead loses the 0.2220–0.2160 support zone. A decisive move beyond either area would give the next direction more clarity. 📊
Guys, follow for more chart analysis 😎 I’ll keep showing you exactly what the chart is telling us. 👀🔥
On the 4H chart, the bigger visible structure is still bullish from the 0.1779 low, with price making a strong series of higher highs and higher lows. But after the rejection from 0.2960, momentum cooled down and we’re currently seeing consolidation around 0.23.
The first important resistance is around 0.2499. A strong 4H break and hold above this area could open the way toward 0.2759, followed by the previous high near 0.2960. Above that, the chart shows 0.3020 as the next visible level.
On the downside, 0.2220–0.2160 is the key support zone to watch. Losing this area could expose 0.1980, while a deeper breakdown could bring the previous 0.1779 low back into focus.
Bullish scenario: reclaiming and holding above 0.2499 → possible targets 0.2759 / 0.2960 / 0.3020.
Bearish scenario: losing 0.2220–0.2160 → possible downside toward 0.1980, with 0.1779 as a deeper level.
For a chart-based setup, a breakout entry could be considered around 0.2500, with SL around 0.2310 and targets 0.2759, 0.2960 and 0.3020. These are levels derived only from the visible chart, not a prediction.
Right now, I’m watching whether price can reclaim 0.2499 or instead loses the 0.2220–0.2160 support zone. A decisive move beyond either area would give the next direction more clarity. 📊
Guys, follow for more chart analysis 😎 I’ll keep showing you exactly what the chart is telling us. 👀🔥