Trading Setup | 9/24 02:20
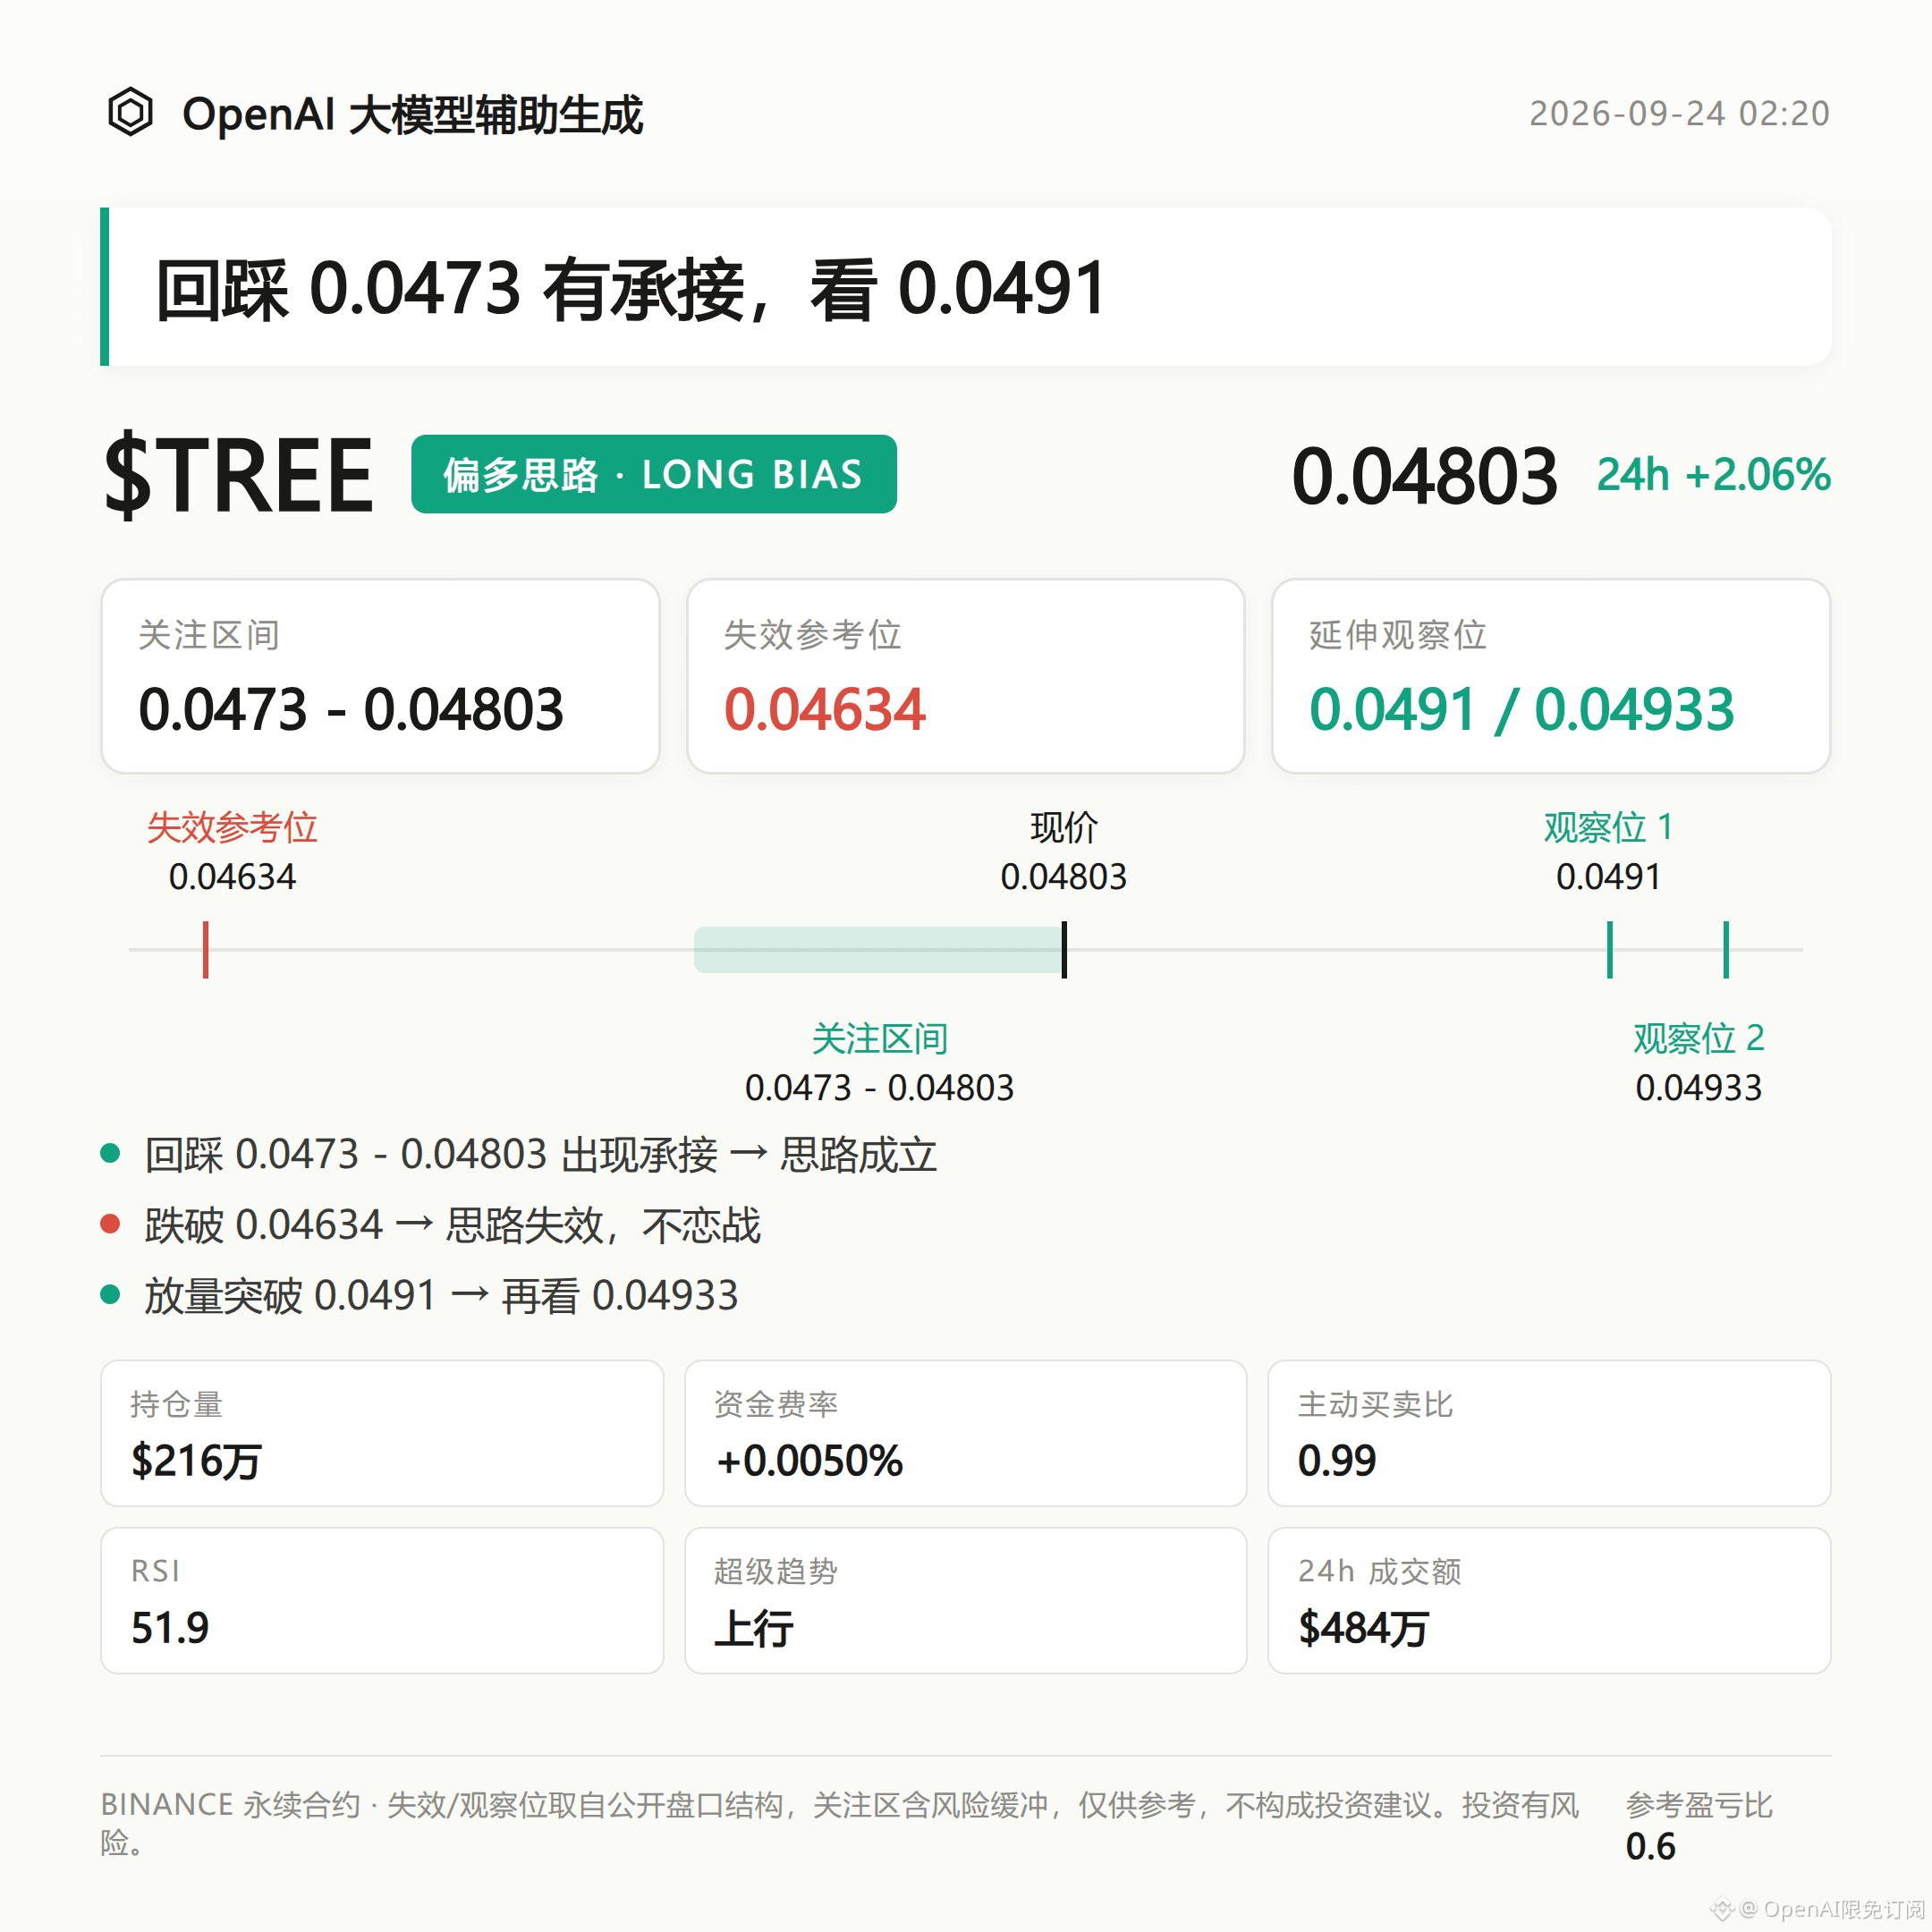
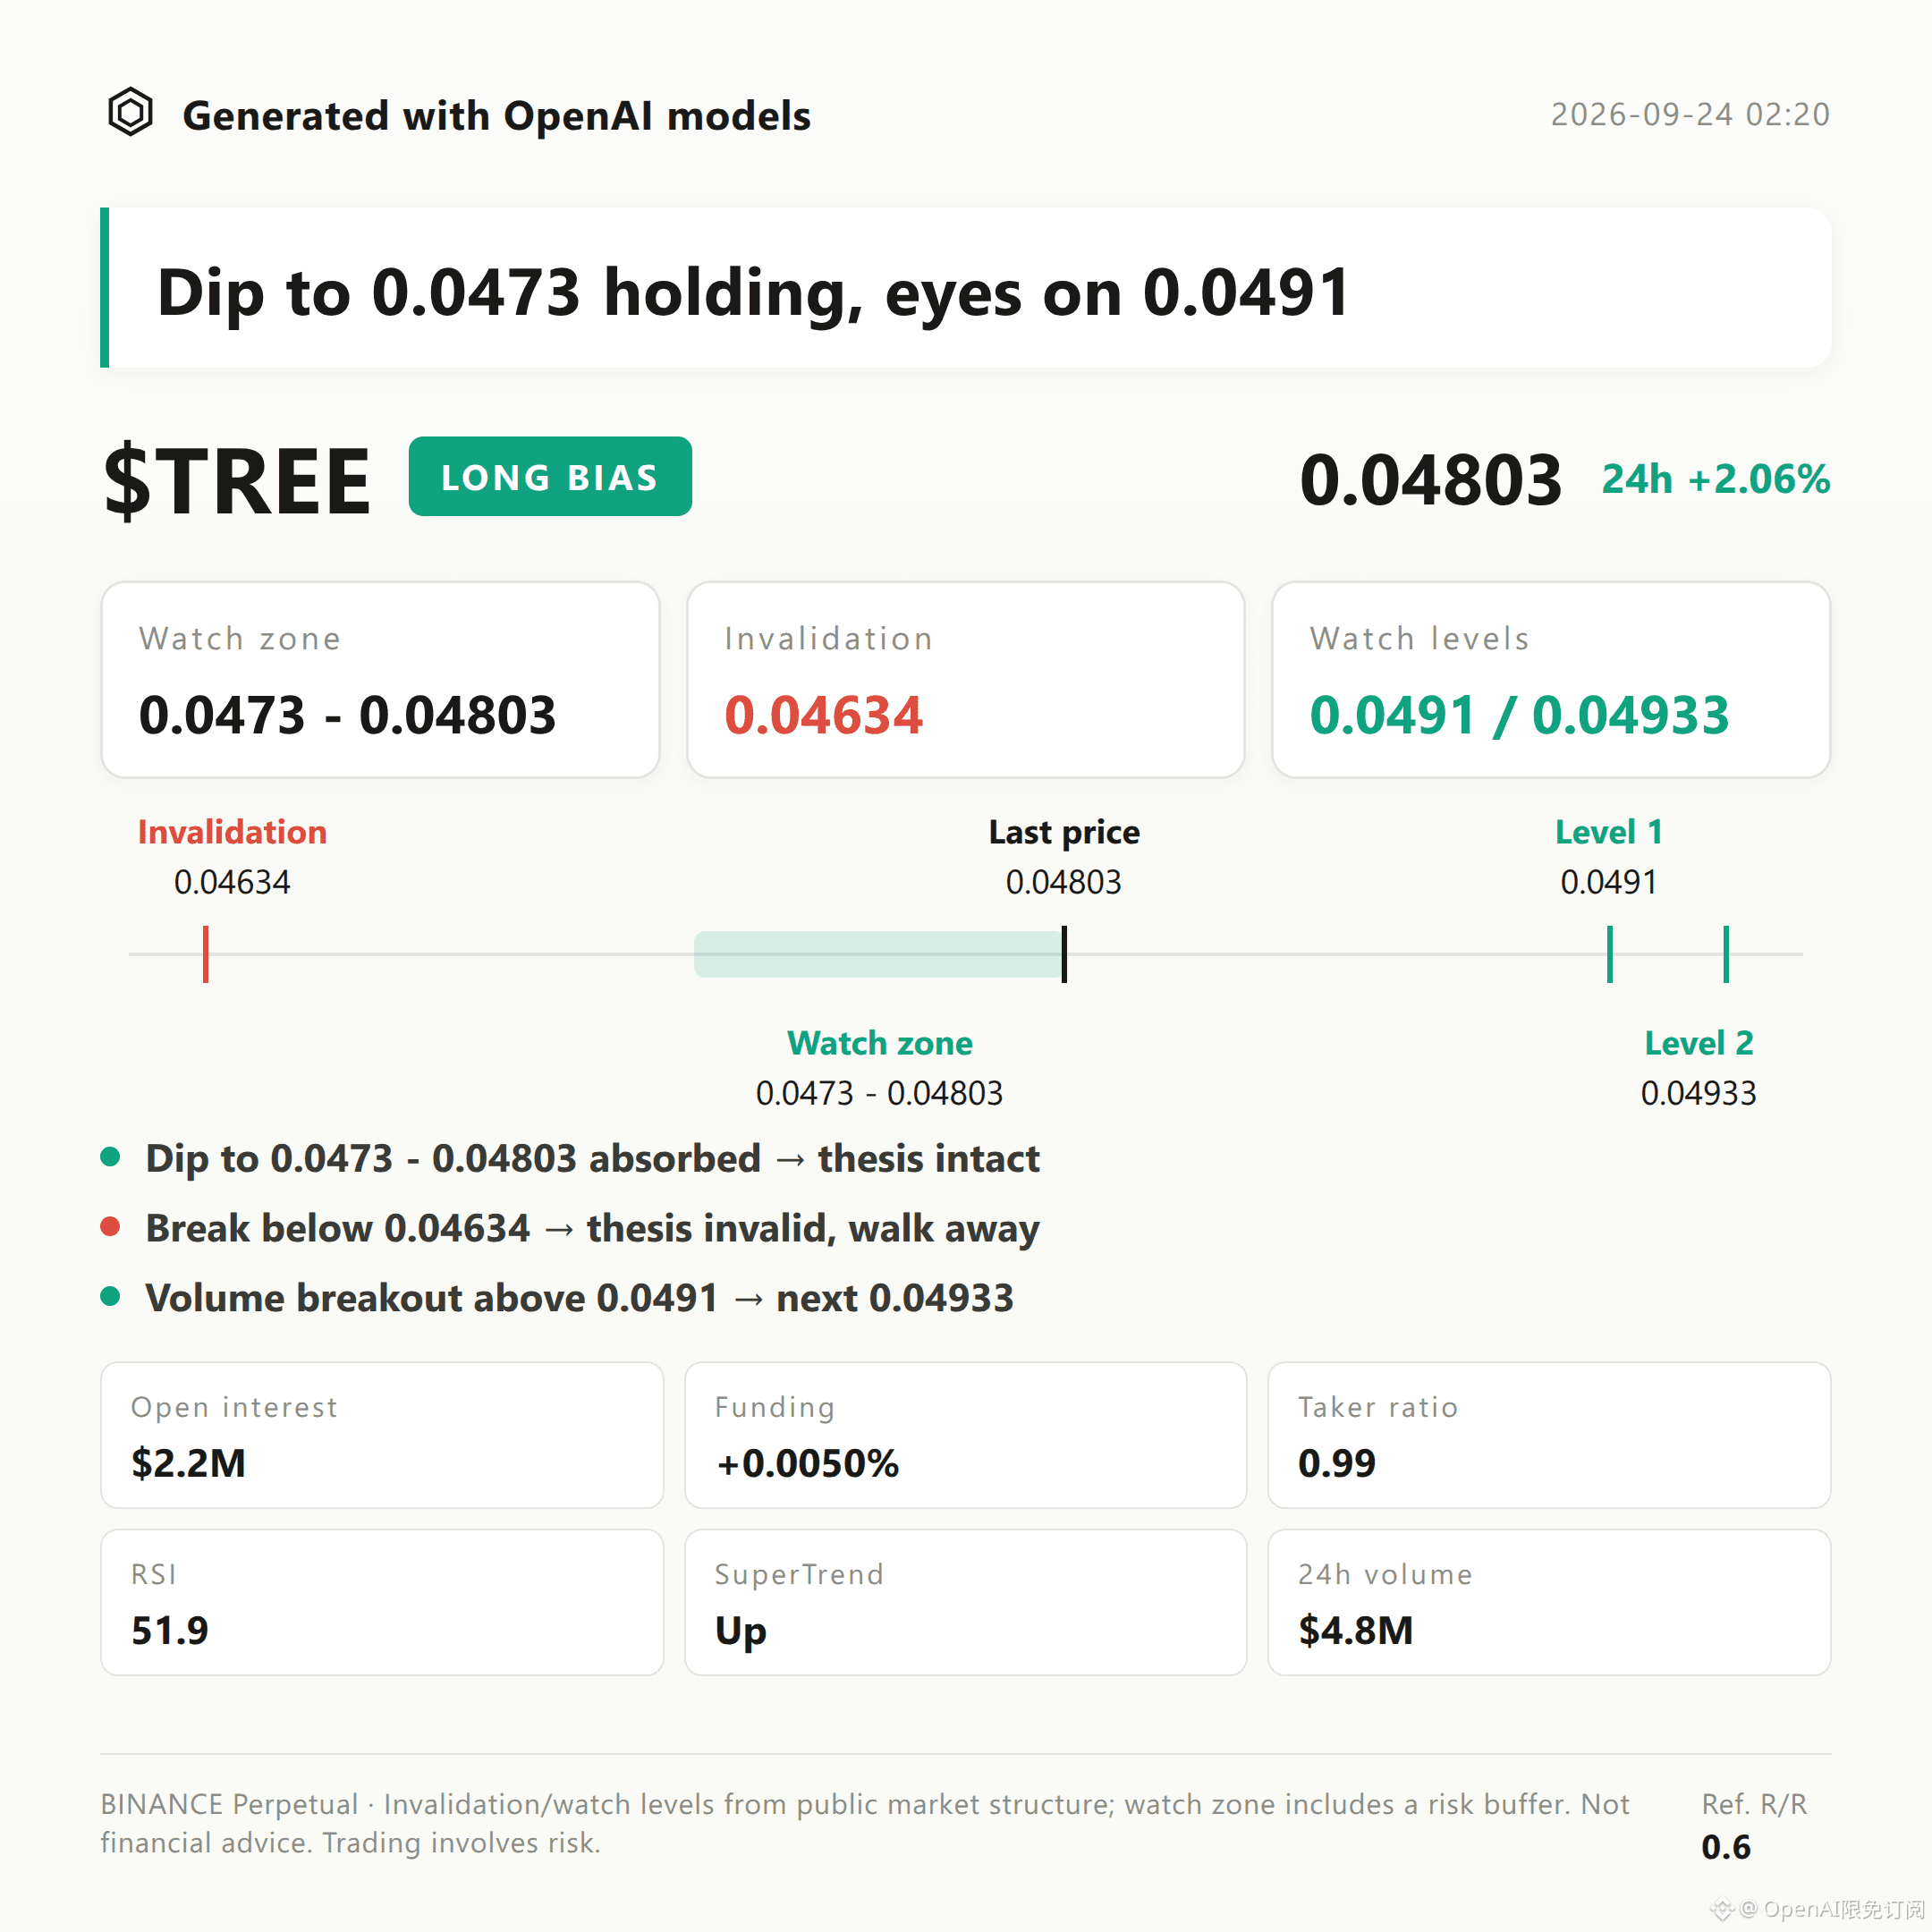
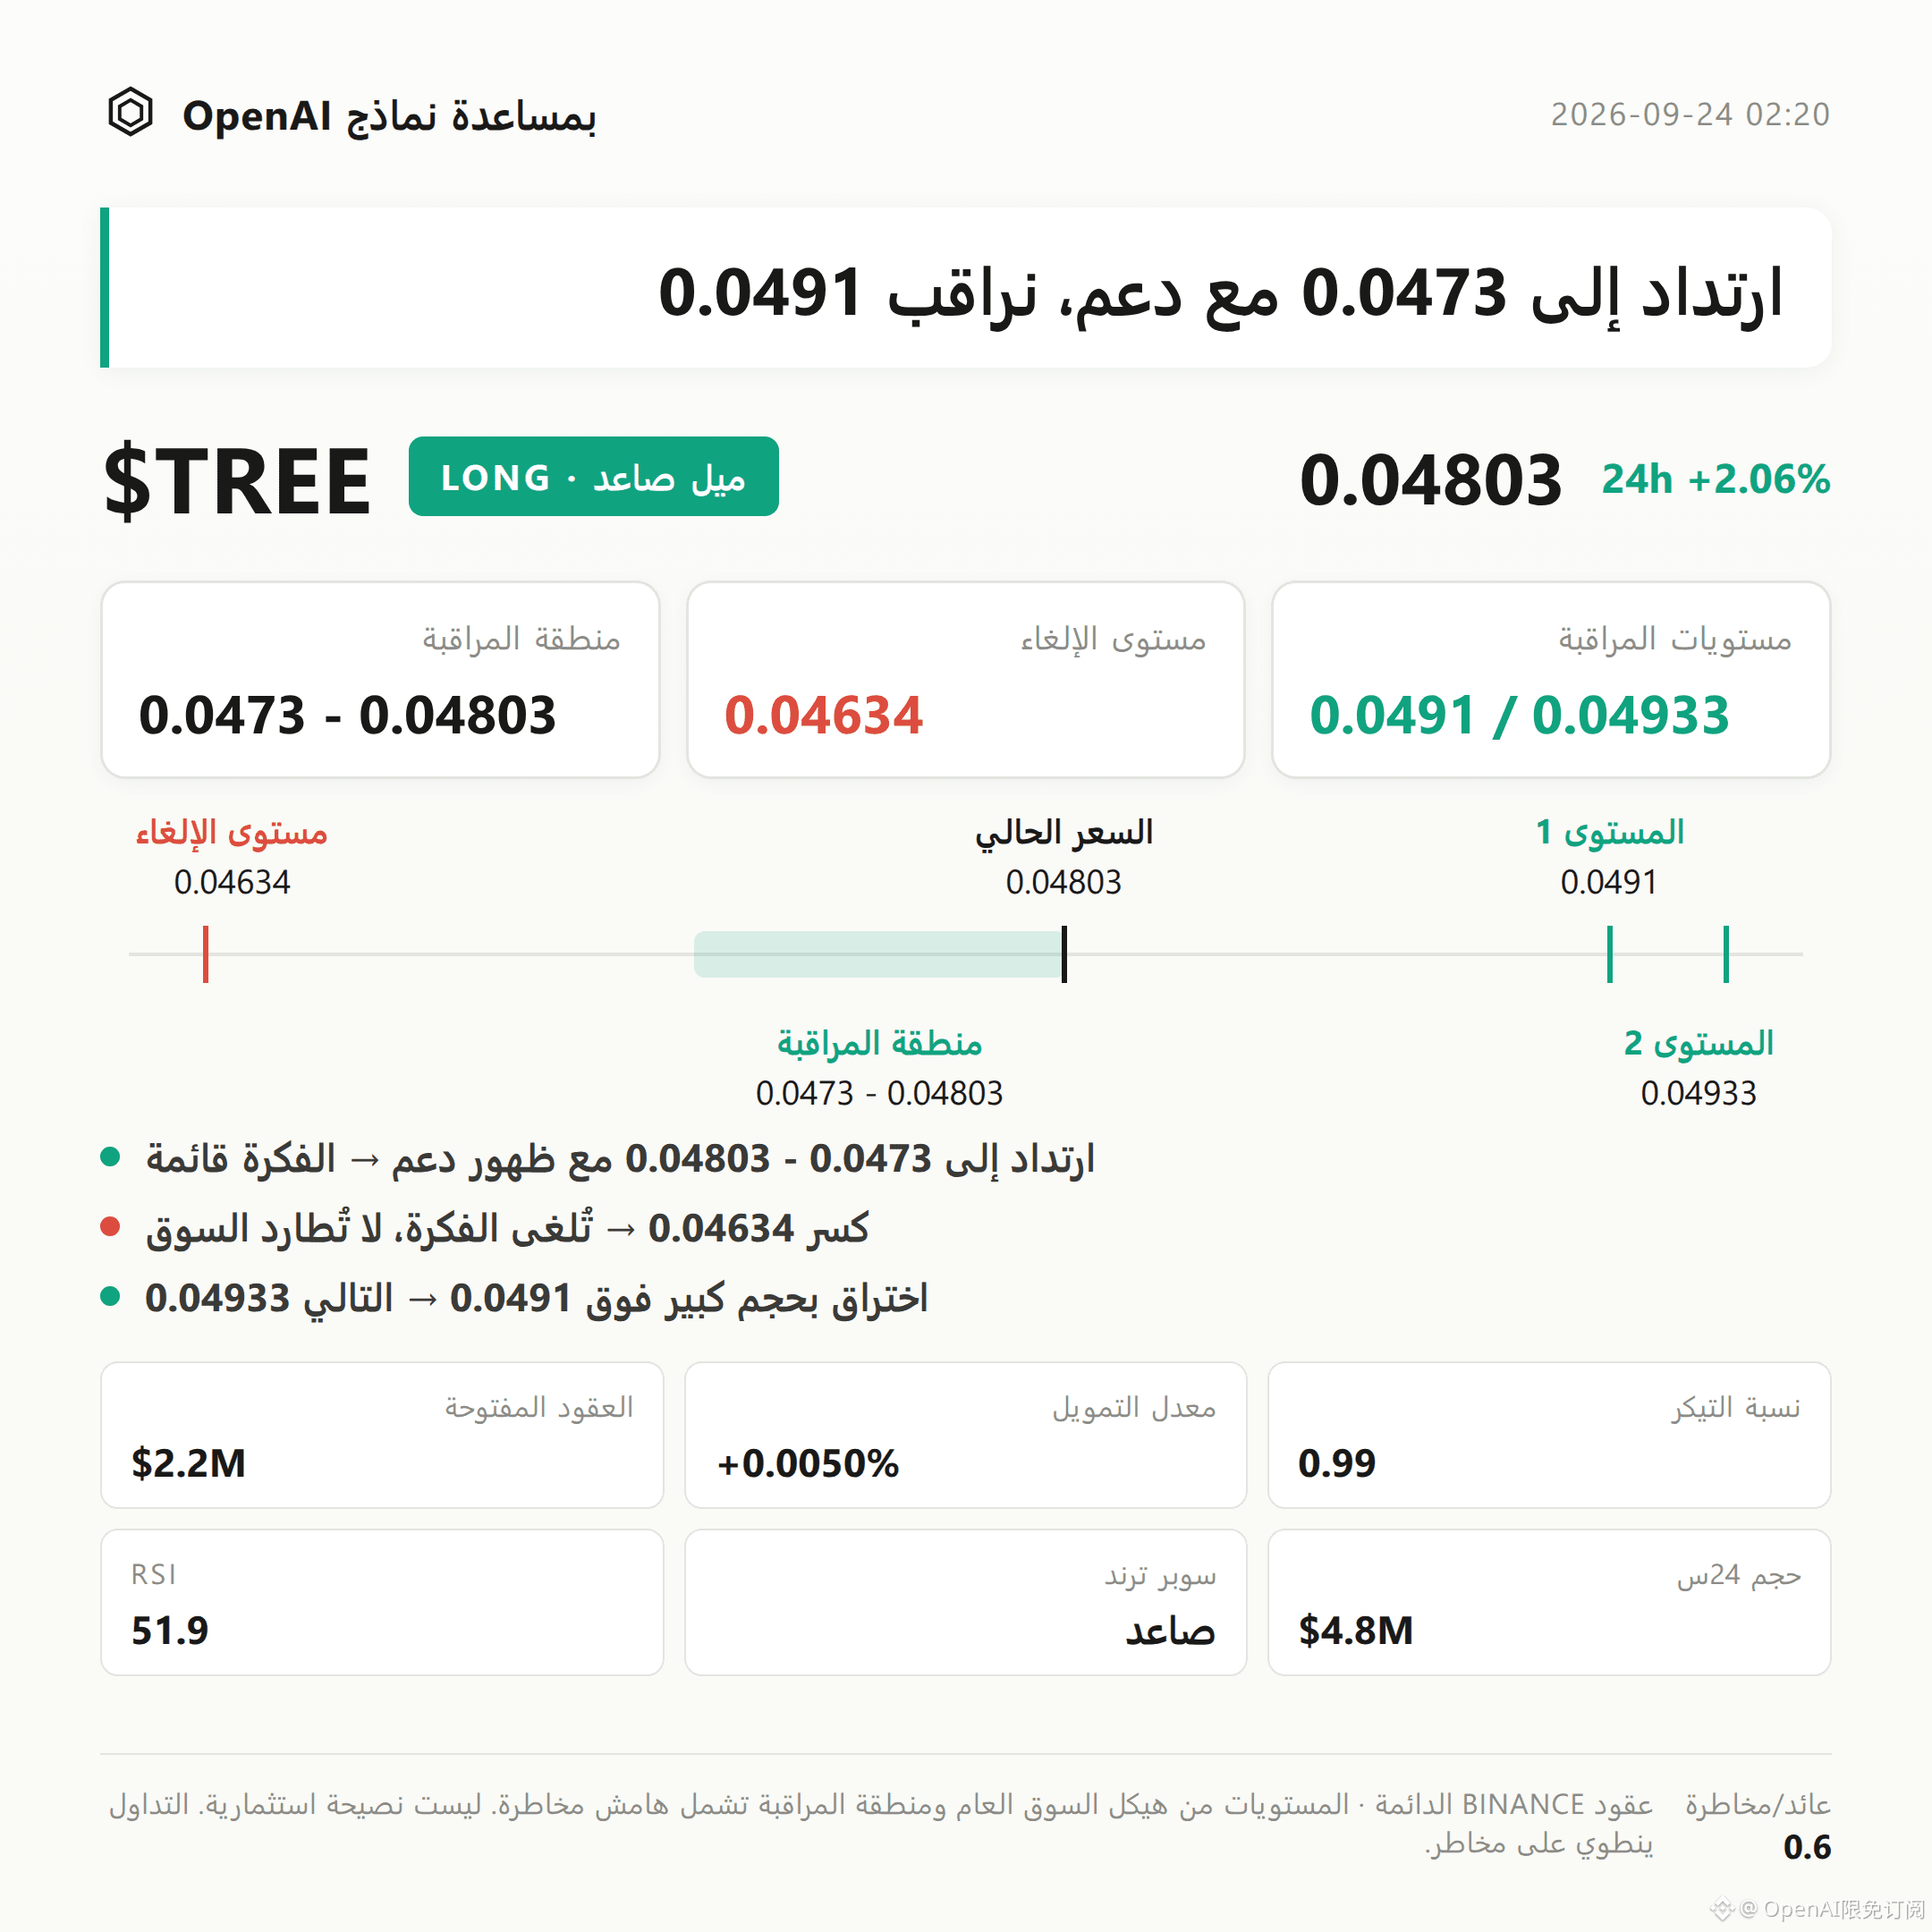
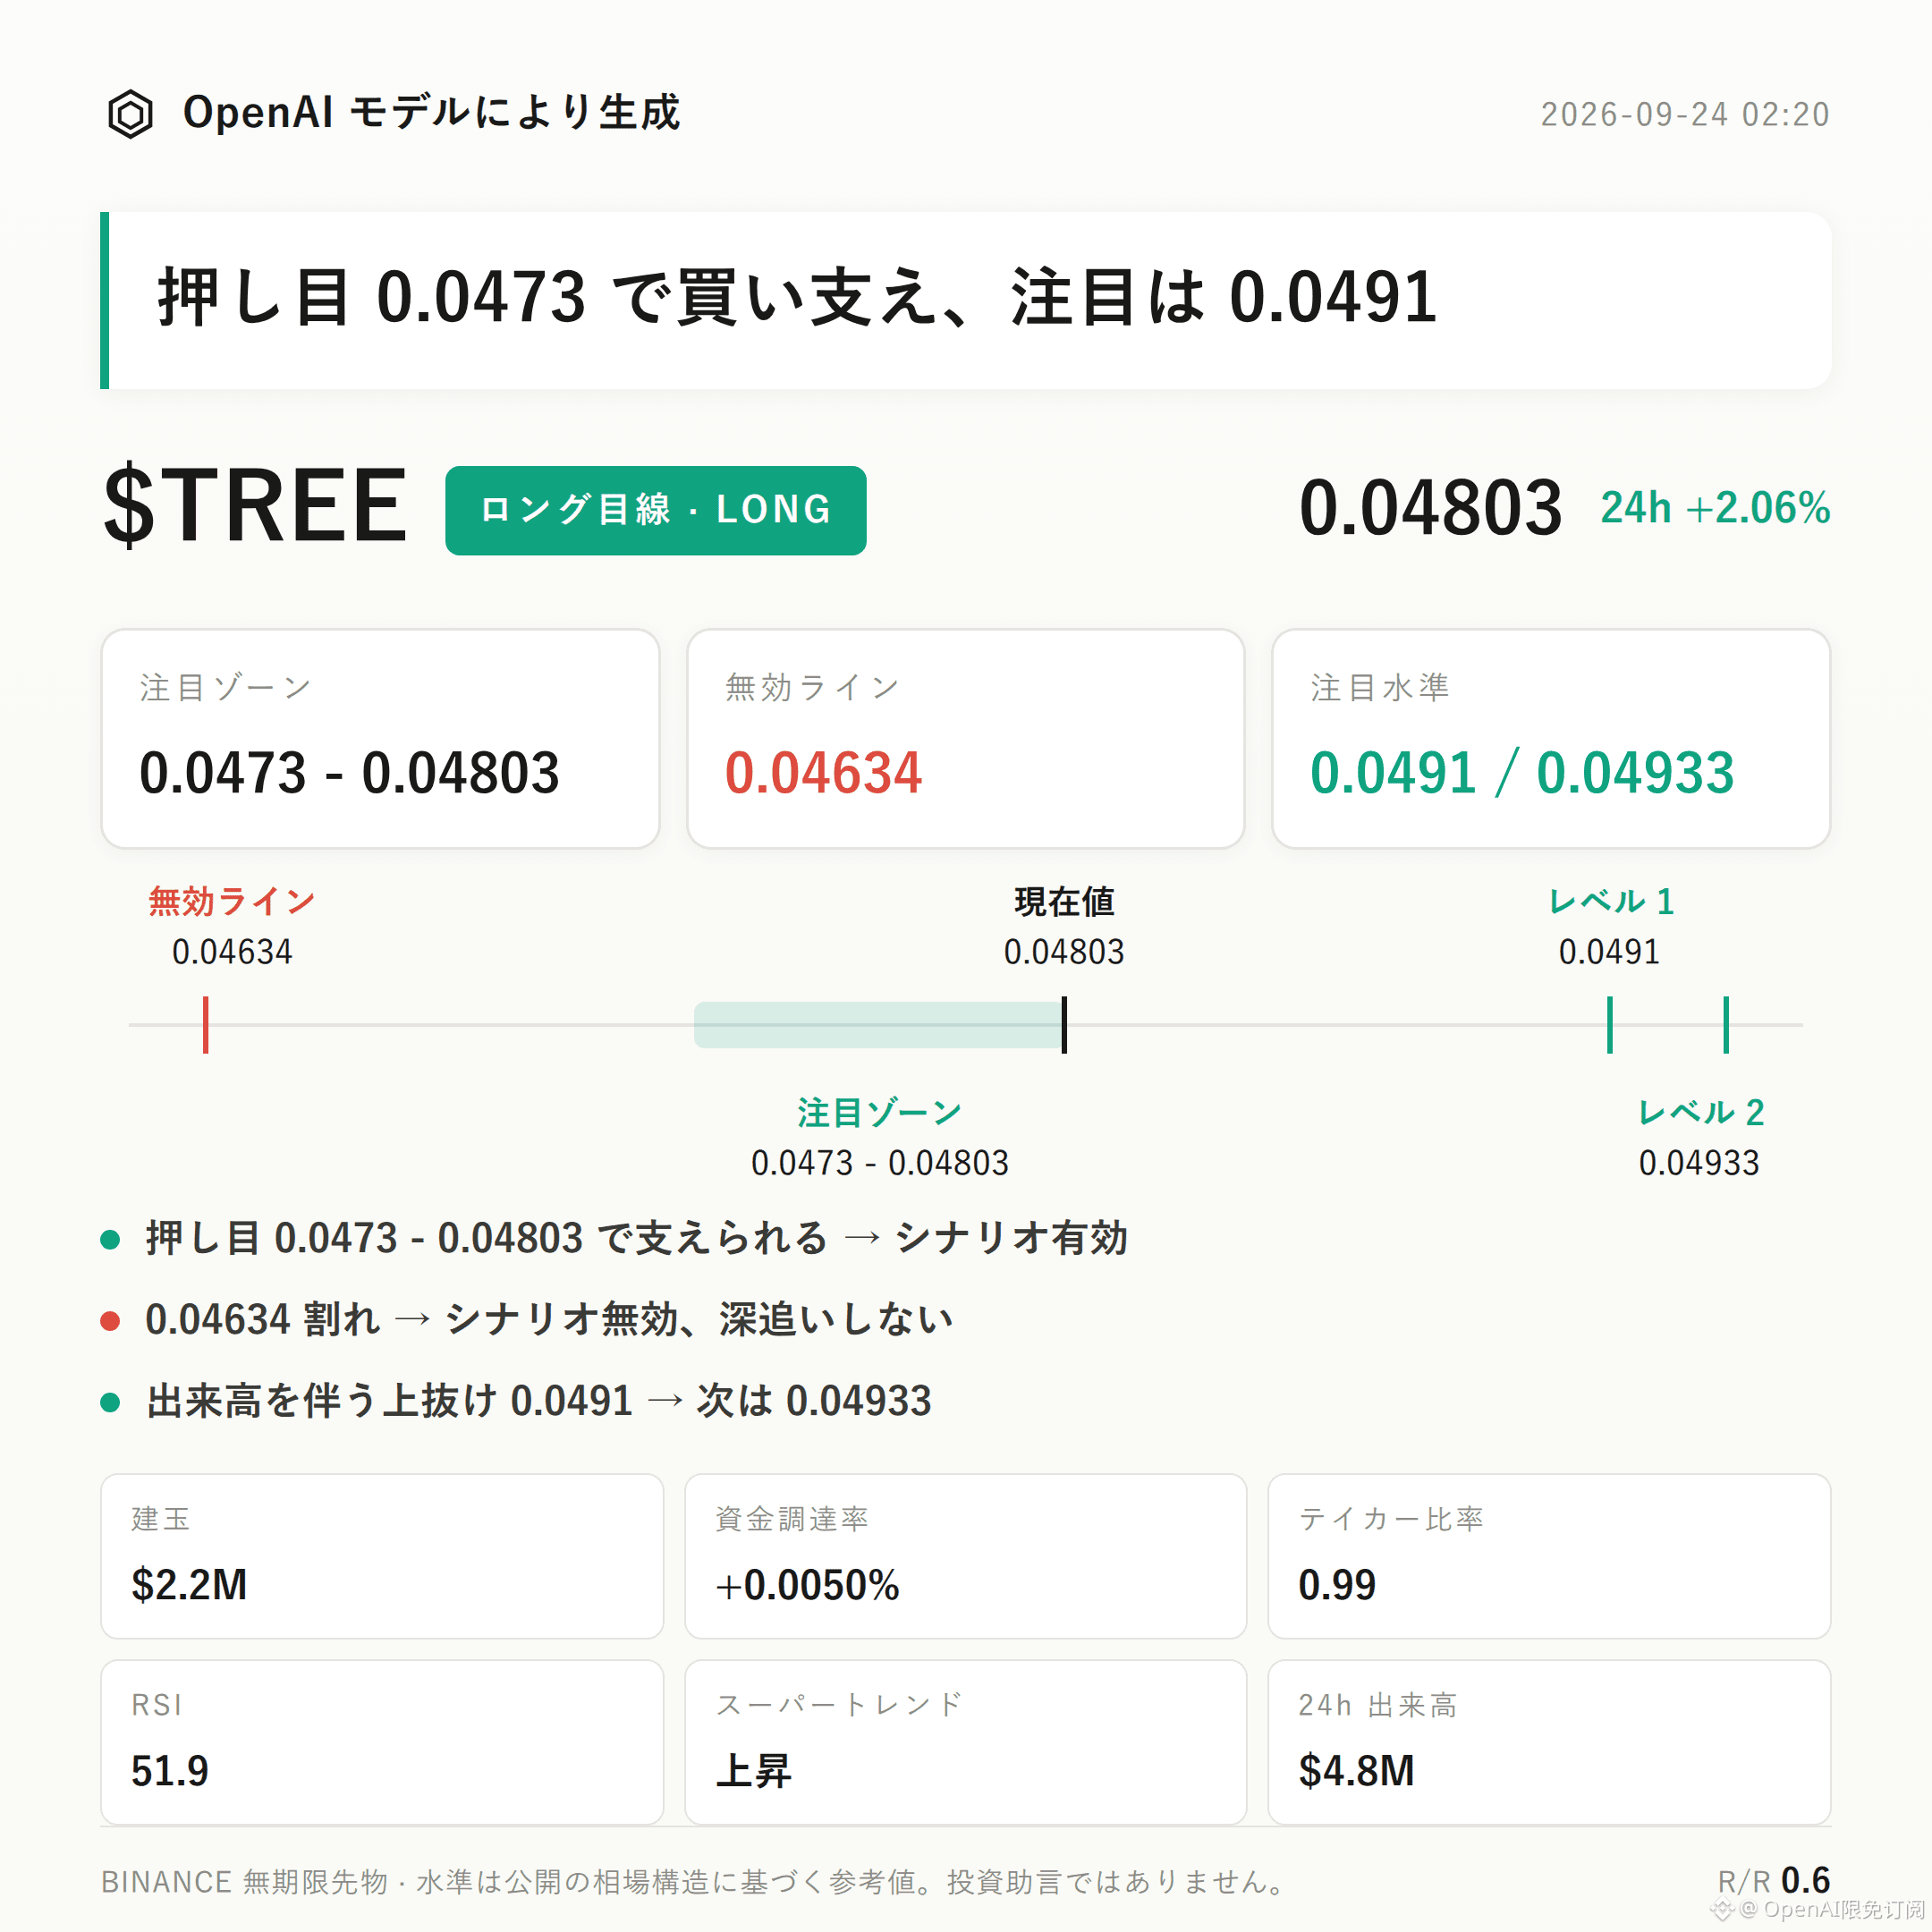
$TREE Bullish bias | Focus zone 0.0473 - 0.04803 | Invalidation reference 0.04634 | Watch levels 0.0491 / 0.04933
$TREE ’s current structure remains bullish.
The SuperTrend stays upward, the MACD holds bullish momentum, and open interest/position volume over the last 24 hours has increased by 13.3%—all three together support this view.
The key is whether, after a pullback, the bullish reference zone can continue to receive support; this will be the way to validate whether the idea can continue.
From the structure: the recent high is 0.04933 and the recent low is 0.04634. The current price (0.04803) is trading near the Bollinger midline (0.0482).
Bollinger upper band is 0.0491 and lower band is 0.0473, so price is between the upper and lower bands, slightly more neutral-to-strong.
RSI is 51.9, within a healthy range—no signs of being overbought, and there is still room to the upside.
With SuperTrend pointing up and MACD showing bullish momentum, the 24-hour rise is +2.06%, and overall the technicals remain in a trend-following posture.
For derivatives data: over the past 24 hours, trading volume is $4.84M, open interest is $2.16M, and open interest increased by 13.3%, indicating signs of position buildup.
Funding rate is +0.0050%. Long-side funding is mildly positive, with no extreme crowding signal yet.
However, the long/short account ratio shows longs at 78%, meaning the structure is somewhat crowded.
The aggressive buy/sell ratio is 0.99—aggressive buyers do not have a clear advantage, suggesting the upside is not completely resistance-free.
On key reference levels: for the bullish focus zone, start by watching 0.0473-0.04803. It’s more suitable to wait for the price to pull back into this area and then look for signs of support before deciding whether the idea remains valid.
If price breaks below 0.04634, it means the current upswing structure is broken; the bullish bias would be invalid, and you should not continue to view it as per the original bullish plan.
If price breaks above 0.0491 with volume, you can then pay attention to the resistance near 0.04933 and see whether the move can be sustained.
It’s important to state the downside risks honestly: the long account share at 78% is relatively high, with a real possibility of being overly crowded.
The aggressive buy/sell ratio of 0.99 also indicates that aggressive buying is not clearly leading; momentum expansion may be limited.
The risk/reward ratio at 0.6 suggests the current odds are not very ideal—reassess cautiously whether the structure is playing out as expected.
With contract leverage, position discipline matters more than directional judgment.
For reference only; not investment advice. Contracts involve leverage, and investing carries risk.
This article was generated with the assistance of an OpenAI model.
$TREE # Contract analysis
$TREE Bullish bias | Focus zone 0.0473 - 0.04803 | Invalidation reference 0.04634 | Watch levels 0.0491 / 0.04933
$TREE ’s current structure remains bullish.
The SuperTrend stays upward, the MACD holds bullish momentum, and open interest/position volume over the last 24 hours has increased by 13.3%—all three together support this view.
The key is whether, after a pullback, the bullish reference zone can continue to receive support; this will be the way to validate whether the idea can continue.
From the structure: the recent high is 0.04933 and the recent low is 0.04634. The current price (0.04803) is trading near the Bollinger midline (0.0482).
Bollinger upper band is 0.0491 and lower band is 0.0473, so price is between the upper and lower bands, slightly more neutral-to-strong.
RSI is 51.9, within a healthy range—no signs of being overbought, and there is still room to the upside.
With SuperTrend pointing up and MACD showing bullish momentum, the 24-hour rise is +2.06%, and overall the technicals remain in a trend-following posture.
For derivatives data: over the past 24 hours, trading volume is $4.84M, open interest is $2.16M, and open interest increased by 13.3%, indicating signs of position buildup.
Funding rate is +0.0050%. Long-side funding is mildly positive, with no extreme crowding signal yet.
However, the long/short account ratio shows longs at 78%, meaning the structure is somewhat crowded.
The aggressive buy/sell ratio is 0.99—aggressive buyers do not have a clear advantage, suggesting the upside is not completely resistance-free.
On key reference levels: for the bullish focus zone, start by watching 0.0473-0.04803. It’s more suitable to wait for the price to pull back into this area and then look for signs of support before deciding whether the idea remains valid.
If price breaks below 0.04634, it means the current upswing structure is broken; the bullish bias would be invalid, and you should not continue to view it as per the original bullish plan.
If price breaks above 0.0491 with volume, you can then pay attention to the resistance near 0.04933 and see whether the move can be sustained.
It’s important to state the downside risks honestly: the long account share at 78% is relatively high, with a real possibility of being overly crowded.
The aggressive buy/sell ratio of 0.99 also indicates that aggressive buying is not clearly leading; momentum expansion may be limited.
The risk/reward ratio at 0.6 suggests the current odds are not very ideal—reassess cautiously whether the structure is playing out as expected.
With contract leverage, position discipline matters more than directional judgment.
For reference only; not investment advice. Contracts involve leverage, and investing carries risk.
This article was generated with the assistance of an OpenAI model.
$TREE # Contract analysis