$SOL Analysis
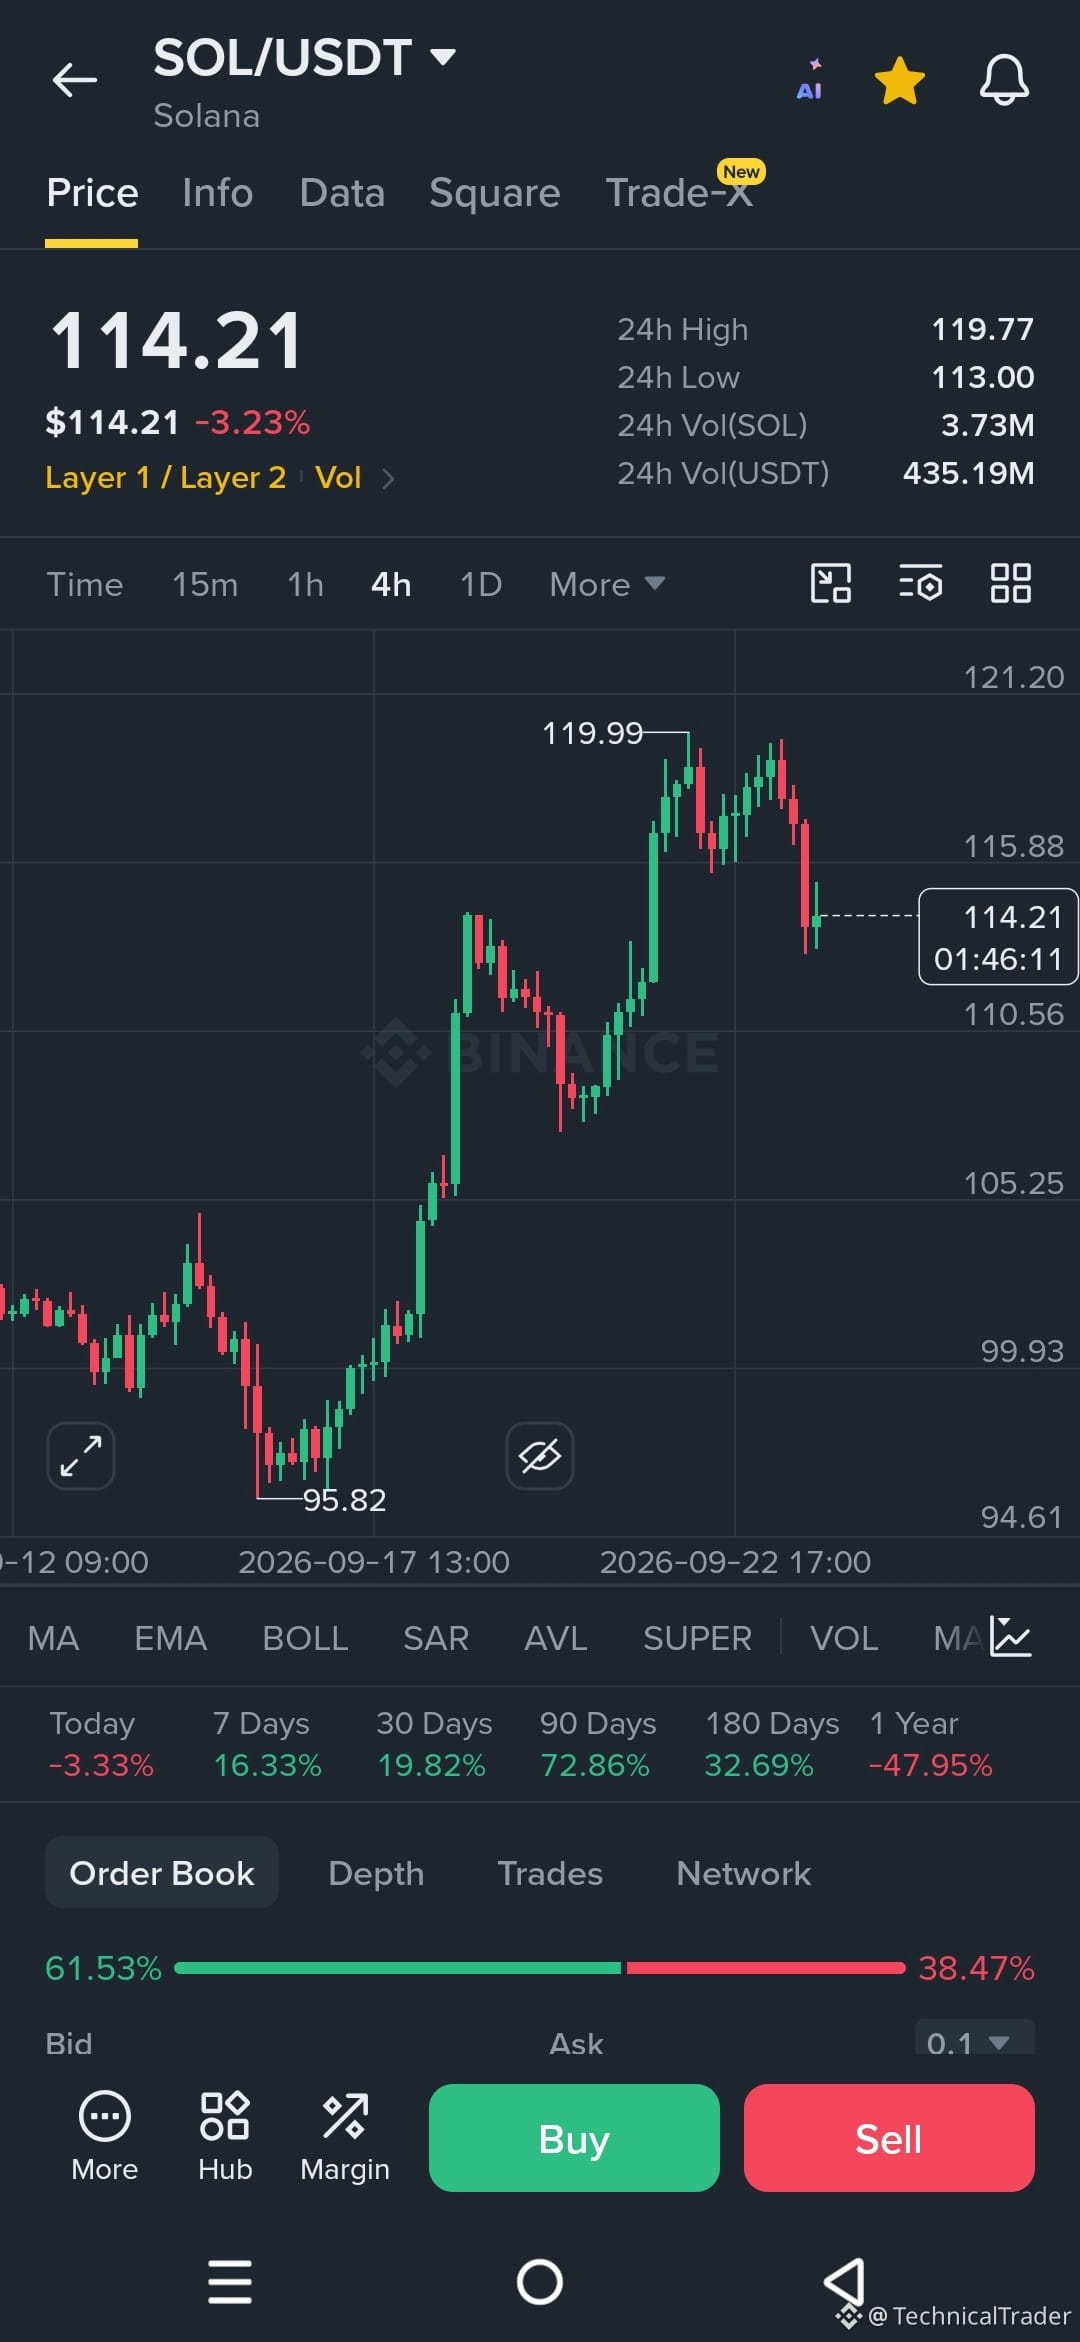
After pushing all the way toward $119.99, price has now pulled back sharply to around $114.21. The question is whether this is just a healthy retracement or the start of a deeper move.
On the 4H chart, SOL still has a strong upward structure from the $95.82 low, with higher highs and higher lows visible. But the recent rejection near $119.99 has brought sellers back into the picture.
The first key area is $110.56–$110.00. Holding this zone could give buyers a chance to recover toward $115.88 and then retest $119.99. A clean break above $119.99 would open the way for a new higher high based on the visible chart.
On the other hand, losing $110.56 could push price toward the previous reaction area around $105.25. If that level also fails, the deeper support around $99.93 becomes important.
The visible order book shows around 61.53% bids vs 38.47% asks, but this is only a snapshot and doesn't confirm what price will do next.
For now, I'm watching $110.56 on the downside and $119.99 on the upside. A sustained break below the recent higher-low structure would weaken the current bullish structure.
Guys, follow for more chart analysis 😎 I’ll keep showing you exactly what the chart is telling us. 👀🔥
After pushing all the way toward $119.99, price has now pulled back sharply to around $114.21. The question is whether this is just a healthy retracement or the start of a deeper move.
On the 4H chart, SOL still has a strong upward structure from the $95.82 low, with higher highs and higher lows visible. But the recent rejection near $119.99 has brought sellers back into the picture.
The first key area is $110.56–$110.00. Holding this zone could give buyers a chance to recover toward $115.88 and then retest $119.99. A clean break above $119.99 would open the way for a new higher high based on the visible chart.
On the other hand, losing $110.56 could push price toward the previous reaction area around $105.25. If that level also fails, the deeper support around $99.93 becomes important.
The visible order book shows around 61.53% bids vs 38.47% asks, but this is only a snapshot and doesn't confirm what price will do next.
For now, I'm watching $110.56 on the downside and $119.99 on the upside. A sustained break below the recent higher-low structure would weaken the current bullish structure.
Guys, follow for more chart analysis 😎 I’ll keep showing you exactly what the chart is telling us. 👀🔥