#ETH | The highest exposure is once again on the side of the longs
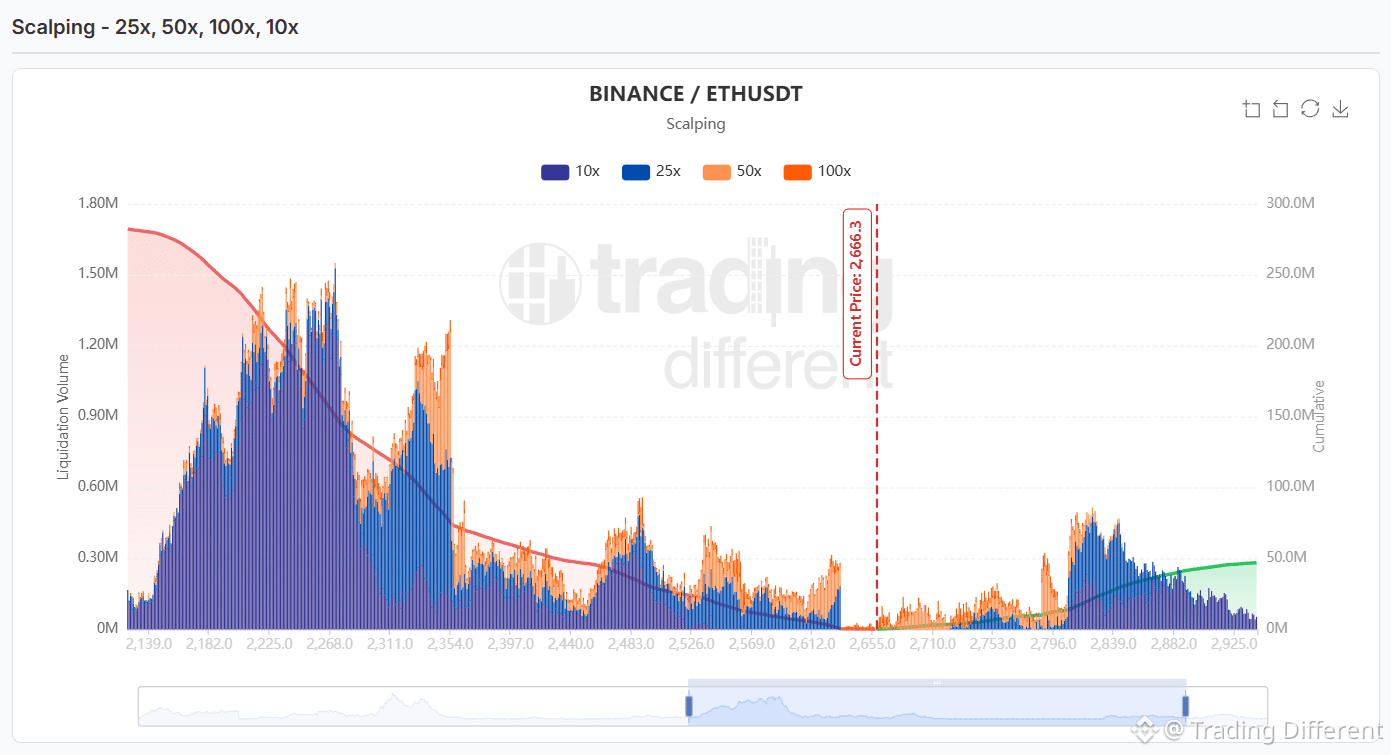
ETH is trading near 2,666 USD, and the 10x, 25x, 50x, and 100x Scalping map shows a significant imbalance between both sides.
🔻 Below, long liquidations clearly dominate the total accumulated amount. The highest concentrations are found roughly between 2,180 and 2,350 USD, with particularly intense blocks around 2,220–2,270 USD and 2,310–2,350 USD.
🔺 Above, the exposure from shorters is considerably smaller. The most relevant area appears further out, mainly between 2,800 and 2,880 USD.
The map provides a clear takeaway: the accumulated liquidation volume is much higher below the current price, even though the upper liquidity between 2,800–2,880 USD remains a reference if ETH regains momentum.
#ETH
🔗 tradingdifferent.com/es/dashboard/liquidation-heatmap?code=binance-square
ETH is trading near 2,666 USD, and the 10x, 25x, 50x, and 100x Scalping map shows a significant imbalance between both sides.
🔻 Below, long liquidations clearly dominate the total accumulated amount. The highest concentrations are found roughly between 2,180 and 2,350 USD, with particularly intense blocks around 2,220–2,270 USD and 2,310–2,350 USD.
🔺 Above, the exposure from shorters is considerably smaller. The most relevant area appears further out, mainly between 2,800 and 2,880 USD.
The map provides a clear takeaway: the accumulated liquidation volume is much higher below the current price, even though the upper liquidity between 2,800–2,880 USD remains a reference if ETH regains momentum.
#ETH
🔗 tradingdifferent.com/es/dashboard/liquidation-heatmap?code=binance-square