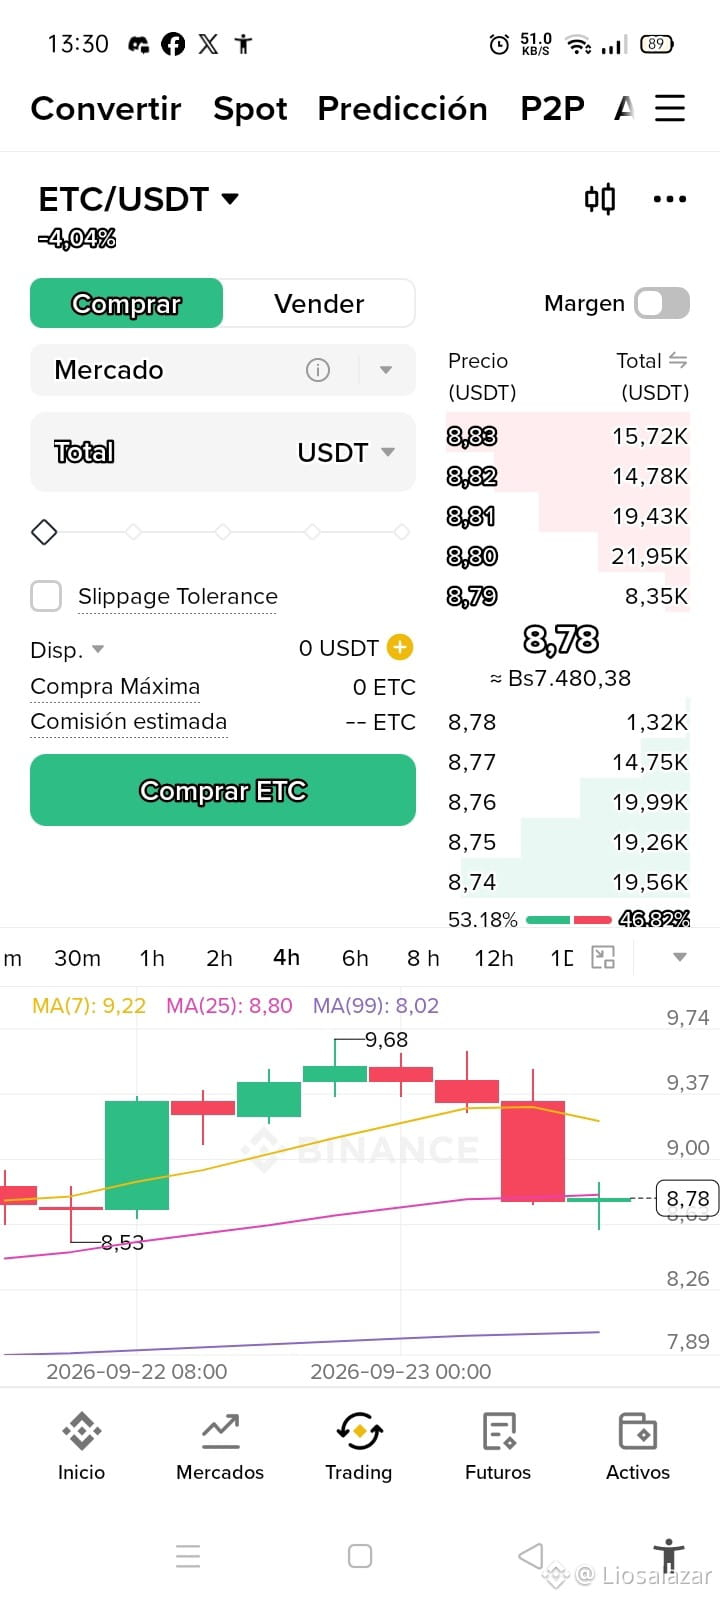
📊 Spot Market Analysis: ETC/USDT 🔴
• Trading Pair: ETC/USDT
• Current Price: 8,78 USDT (-4,04%)
• Moving Averages (Chart):
• MA(7): 9,22 (Main dynamic resistance in the short term)
• MA(25): 8,80 (Immediate dynamic resistance)
• MA(99): 8,02 (Higher-timeframe structural support)
• Trend Structure: After reaching a peak at 9,68 USDT, the price experienced a sharp pullback that broke the MA(7) and slightly pierced the MA(25), marking a low on this candle. It is currently trading close to the MA(25) zone at 8,78 USDT.
💡 Strategy: Keep a close watch on whether buyers can hold and reclaim the MA(25) at $8,80 USDT to look for a bounce toward $9,00 USDT. A sustained break below paves the way to test the $8,53 USDT area or the key support at the MA(99) of $8,02 USDT.
💬 Do you think a bounce is likely in the MA(25) zone, or will you stay cautious about the $ETC correction? I’m reading your comments! 👇
$ETC USDTBTC
• Trading Pair: ETC/USDT
• Current Price: 8,78 USDT (-4,04%)
• Moving Averages (Chart):
• MA(7): 9,22 (Main dynamic resistance in the short term)
• MA(25): 8,80 (Immediate dynamic resistance)
• MA(99): 8,02 (Higher-timeframe structural support)
• Trend Structure: After reaching a peak at 9,68 USDT, the price experienced a sharp pullback that broke the MA(7) and slightly pierced the MA(25), marking a low on this candle. It is currently trading close to the MA(25) zone at 8,78 USDT.
💡 Strategy: Keep a close watch on whether buyers can hold and reclaim the MA(25) at $8,80 USDT to look for a bounce toward $9,00 USDT. A sustained break below paves the way to test the $8,53 USDT area or the key support at the MA(99) of $8,02 USDT.
💬 Do you think a bounce is likely in the MA(25) zone, or will you stay cautious about the $ETC correction? I’m reading your comments! 👇
$ETC USDTBTC