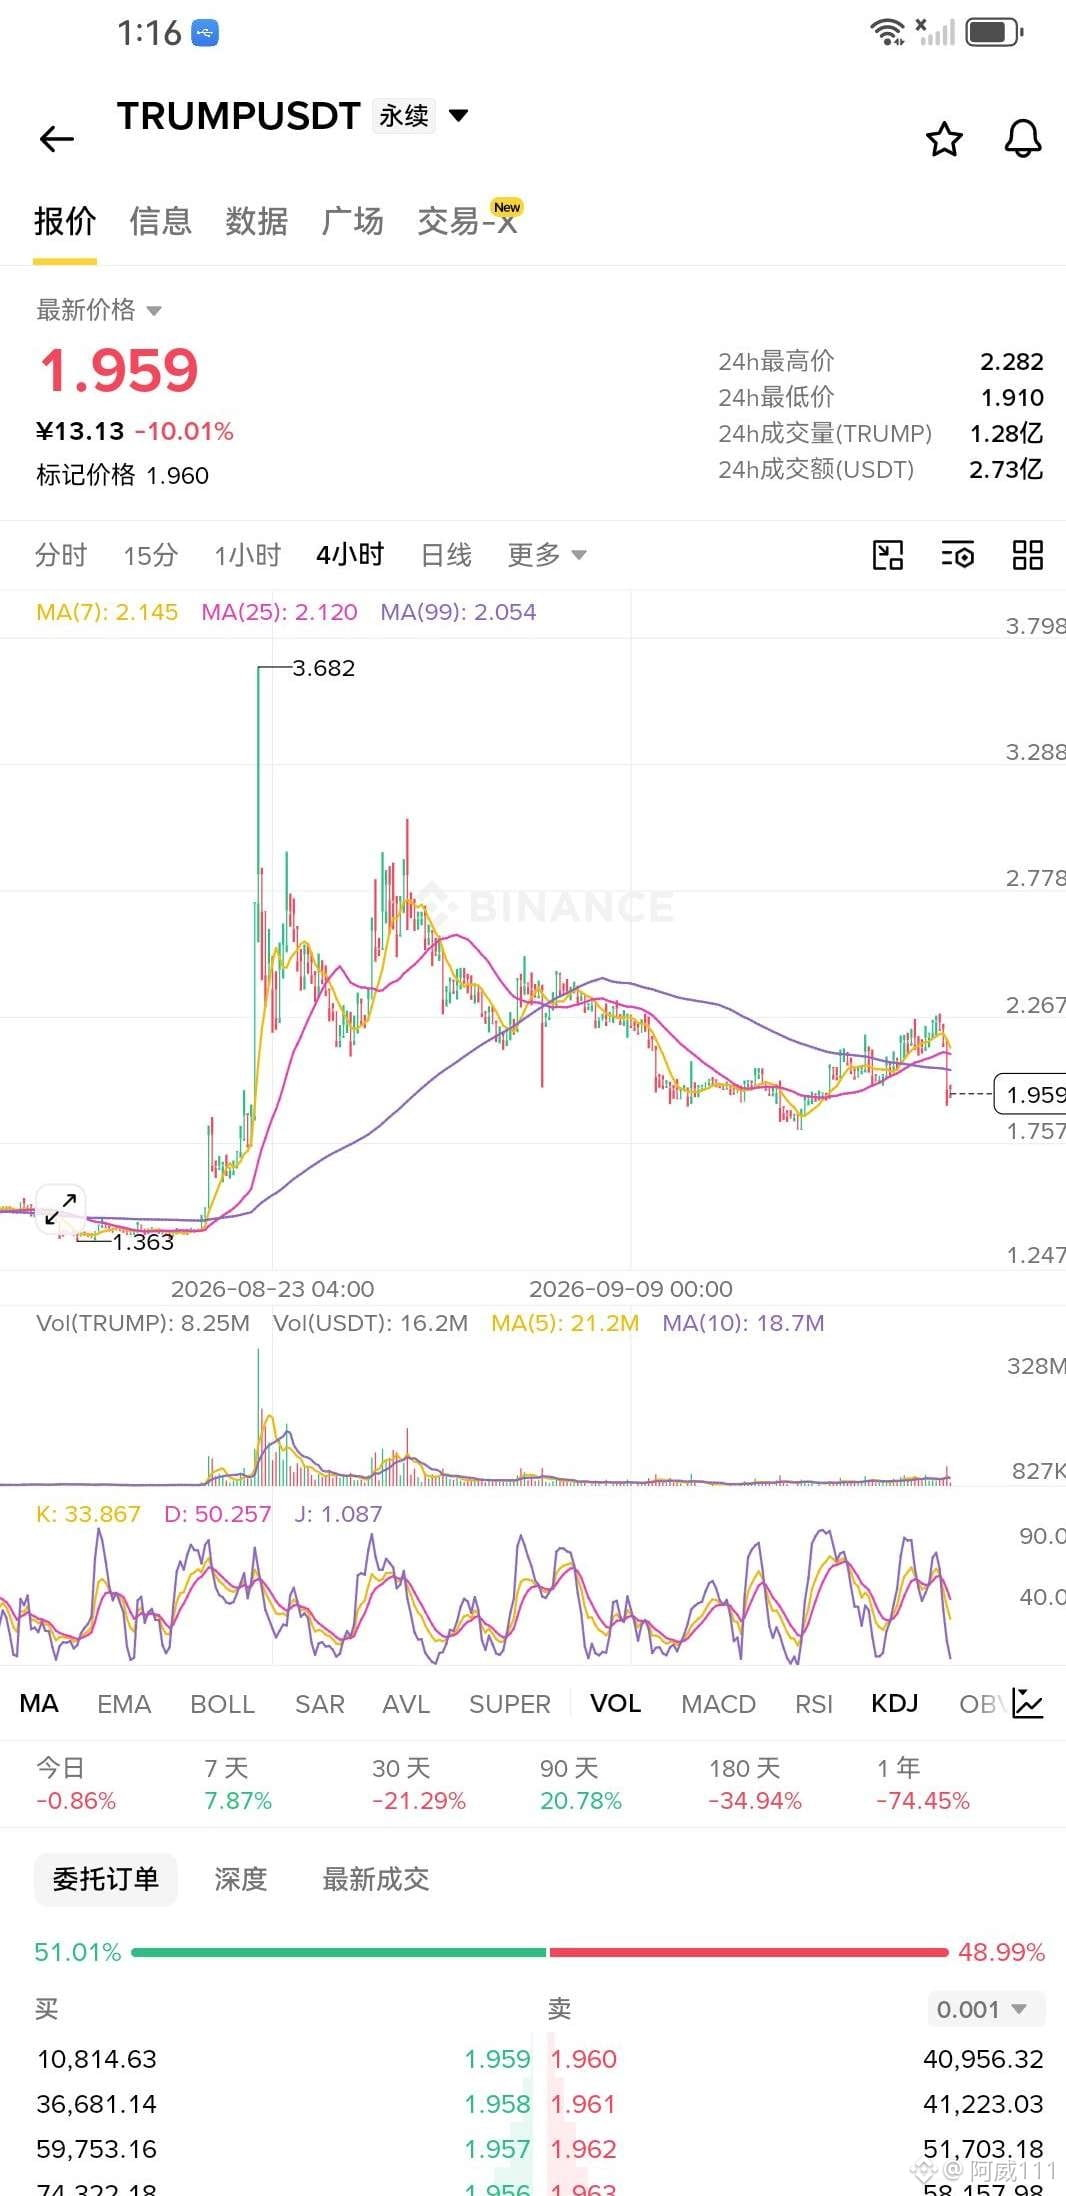
$TRUMP say it straight: this chart is already hard to look at! After breaking below the two moving averages, it’s been accelerating all the way—on the hourly chart there have been six straight bearish (green) candles, and the bulls haven’t even managed to catch their breath! Behind it all, open interest isn’t decreasing but increasing instead—while the shorts are adding positions and hammering it down. Fees are also squeezed into negative territory, and aggressive sell orders are pinning the buy orders to the ground and grinding them! On the surface there’s still a rise over the past seven days, but underneath it’s all bubbles. The end of this tug-of-war is only lower! $TRUMP


Post

--
Disclaimer: Includes third-party opinions. No advice. Binance AI may be used without guarantee. See T&Cs.