$ETH Crypto Academicians in the Coin World: 9.24 Ethereum (ETH) surged high then stalled—what hidden divergence is lurking? Breakdown of the underlying technical logic behind this pullback? Latest market analysis reference
Ethereum’s current price is 2670. The market is playing a roller coaster—many crypto friends were bullish at high levels, only to see profits evaporate or even get trapped. After pushing up to 2800, the bulls lost steam; sell pressure clustered and surged, and the price quickly dropped. The market doesn’t rise forever—it won’t follow what people think. When it goes up too much, it will pull back; when it drops too much, it may rebound. Trading isn’t about gambling on up or down; it’s about waiting for opportunities with an acceptable risk-reward ratio. This retracement is a good chance.
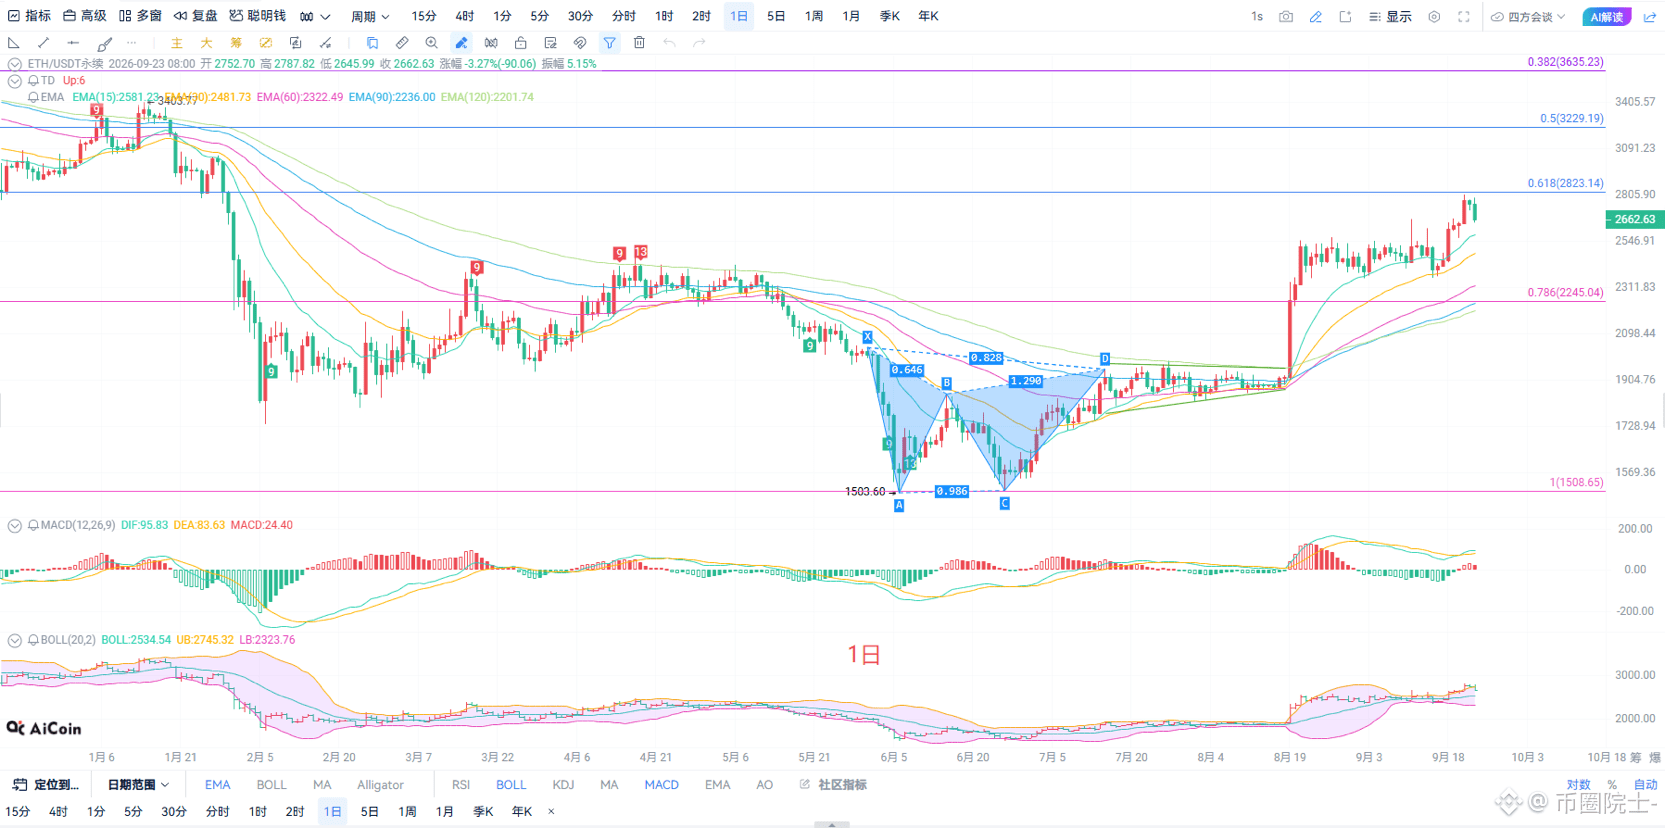
On the daily chart, price is revisiting the short-term EMA15 line. The MACD histogram’s red bars keep shrinking, and bullish momentum is continuously weakening, with signs the indicator is turning downward. The Bollinger Bands show price has detached from the upper band and is starting to test the middle-band support to the downside. From the wave structure perspective, this pullback after the recent rally is a normal corrective repair, and the large-cycle upward structure has not been fully broken. Strong resistance overhead is at 2823, which has been tested multiple times and rejected. Next, focus on whether support at the EMA30 line holds; if it holds, there’s still a chance for a second push higher. If it breaks, the correction period will likely extend.
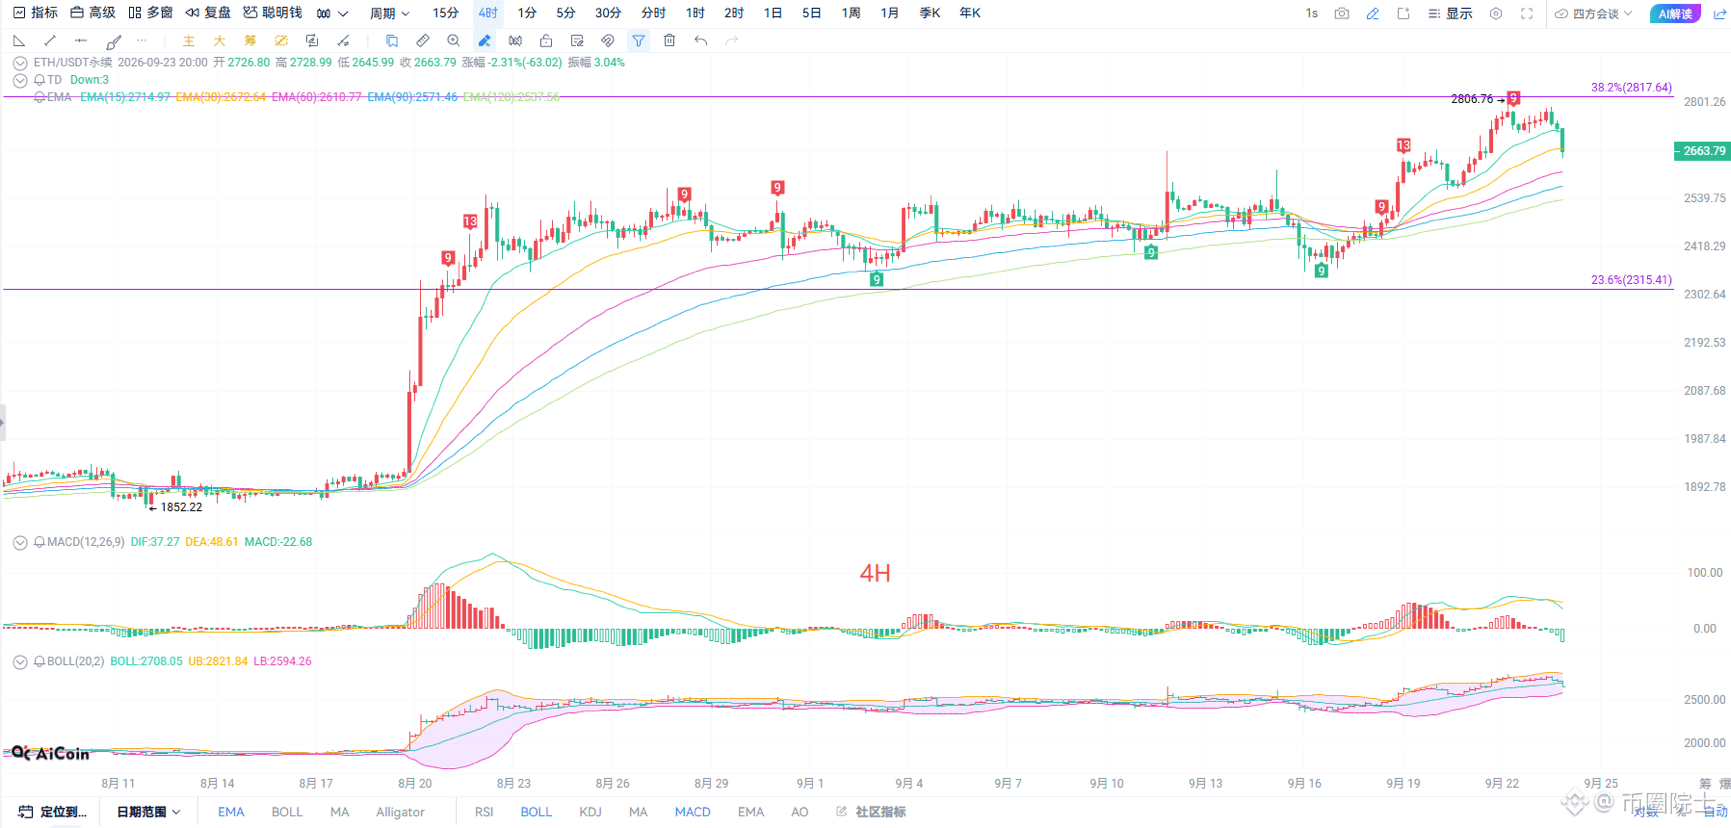
On the four-hour chart, a single strong bearish candle broke below the short-term moving-average cluster, weakening the short-term trend. The MACD dead cross points downward, the green histogram keeps expanding, and bearish momentum is being released. The Bollinger Bands are opening downward, and price is trading below the middle band; the moving-average system has shifted from support to resistance. The high at 2817—the 38.2% Fibonacci level—becomes the short-term top, so subsequent rebounds will face moving-average suppression. The 4-hour timeframe is currently in the adjustment phase. To return to a bullish trend, price needs to reclaim and hold above the EMA30. Until it does, treat all rebounds primarily as pullbacks; don’t rush to bottom-fish and go long.
Short-term references:
If price breaks below 2650 to 2610 going north, cut loss at 40 points; targets are 2720 to 2760.
If price fails to break 2730 to 2760 going down, cut loss at 40 points; targets are 2700 to 2660.
Specific execution should rely on live order-book data. For more information, you can consult the author. Note that the article’s publishing time may be delayed—this is for reference only; risks are your own responsibility.
#ETH合约
Ethereum’s current price is 2670. The market is playing a roller coaster—many crypto friends were bullish at high levels, only to see profits evaporate or even get trapped. After pushing up to 2800, the bulls lost steam; sell pressure clustered and surged, and the price quickly dropped. The market doesn’t rise forever—it won’t follow what people think. When it goes up too much, it will pull back; when it drops too much, it may rebound. Trading isn’t about gambling on up or down; it’s about waiting for opportunities with an acceptable risk-reward ratio. This retracement is a good chance.
On the daily chart, price is revisiting the short-term EMA15 line. The MACD histogram’s red bars keep shrinking, and bullish momentum is continuously weakening, with signs the indicator is turning downward. The Bollinger Bands show price has detached from the upper band and is starting to test the middle-band support to the downside. From the wave structure perspective, this pullback after the recent rally is a normal corrective repair, and the large-cycle upward structure has not been fully broken. Strong resistance overhead is at 2823, which has been tested multiple times and rejected. Next, focus on whether support at the EMA30 line holds; if it holds, there’s still a chance for a second push higher. If it breaks, the correction period will likely extend.
On the four-hour chart, a single strong bearish candle broke below the short-term moving-average cluster, weakening the short-term trend. The MACD dead cross points downward, the green histogram keeps expanding, and bearish momentum is being released. The Bollinger Bands are opening downward, and price is trading below the middle band; the moving-average system has shifted from support to resistance. The high at 2817—the 38.2% Fibonacci level—becomes the short-term top, so subsequent rebounds will face moving-average suppression. The 4-hour timeframe is currently in the adjustment phase. To return to a bullish trend, price needs to reclaim and hold above the EMA30. Until it does, treat all rebounds primarily as pullbacks; don’t rush to bottom-fish and go long.
Short-term references:
If price breaks below 2650 to 2610 going north, cut loss at 40 points; targets are 2720 to 2760.
If price fails to break 2730 to 2760 going down, cut loss at 40 points; targets are 2700 to 2660.
Specific execution should rely on live order-book data. For more information, you can consult the author. Note that the article’s publishing time may be delayed—this is for reference only; risks are your own responsibility.
#ETH合约