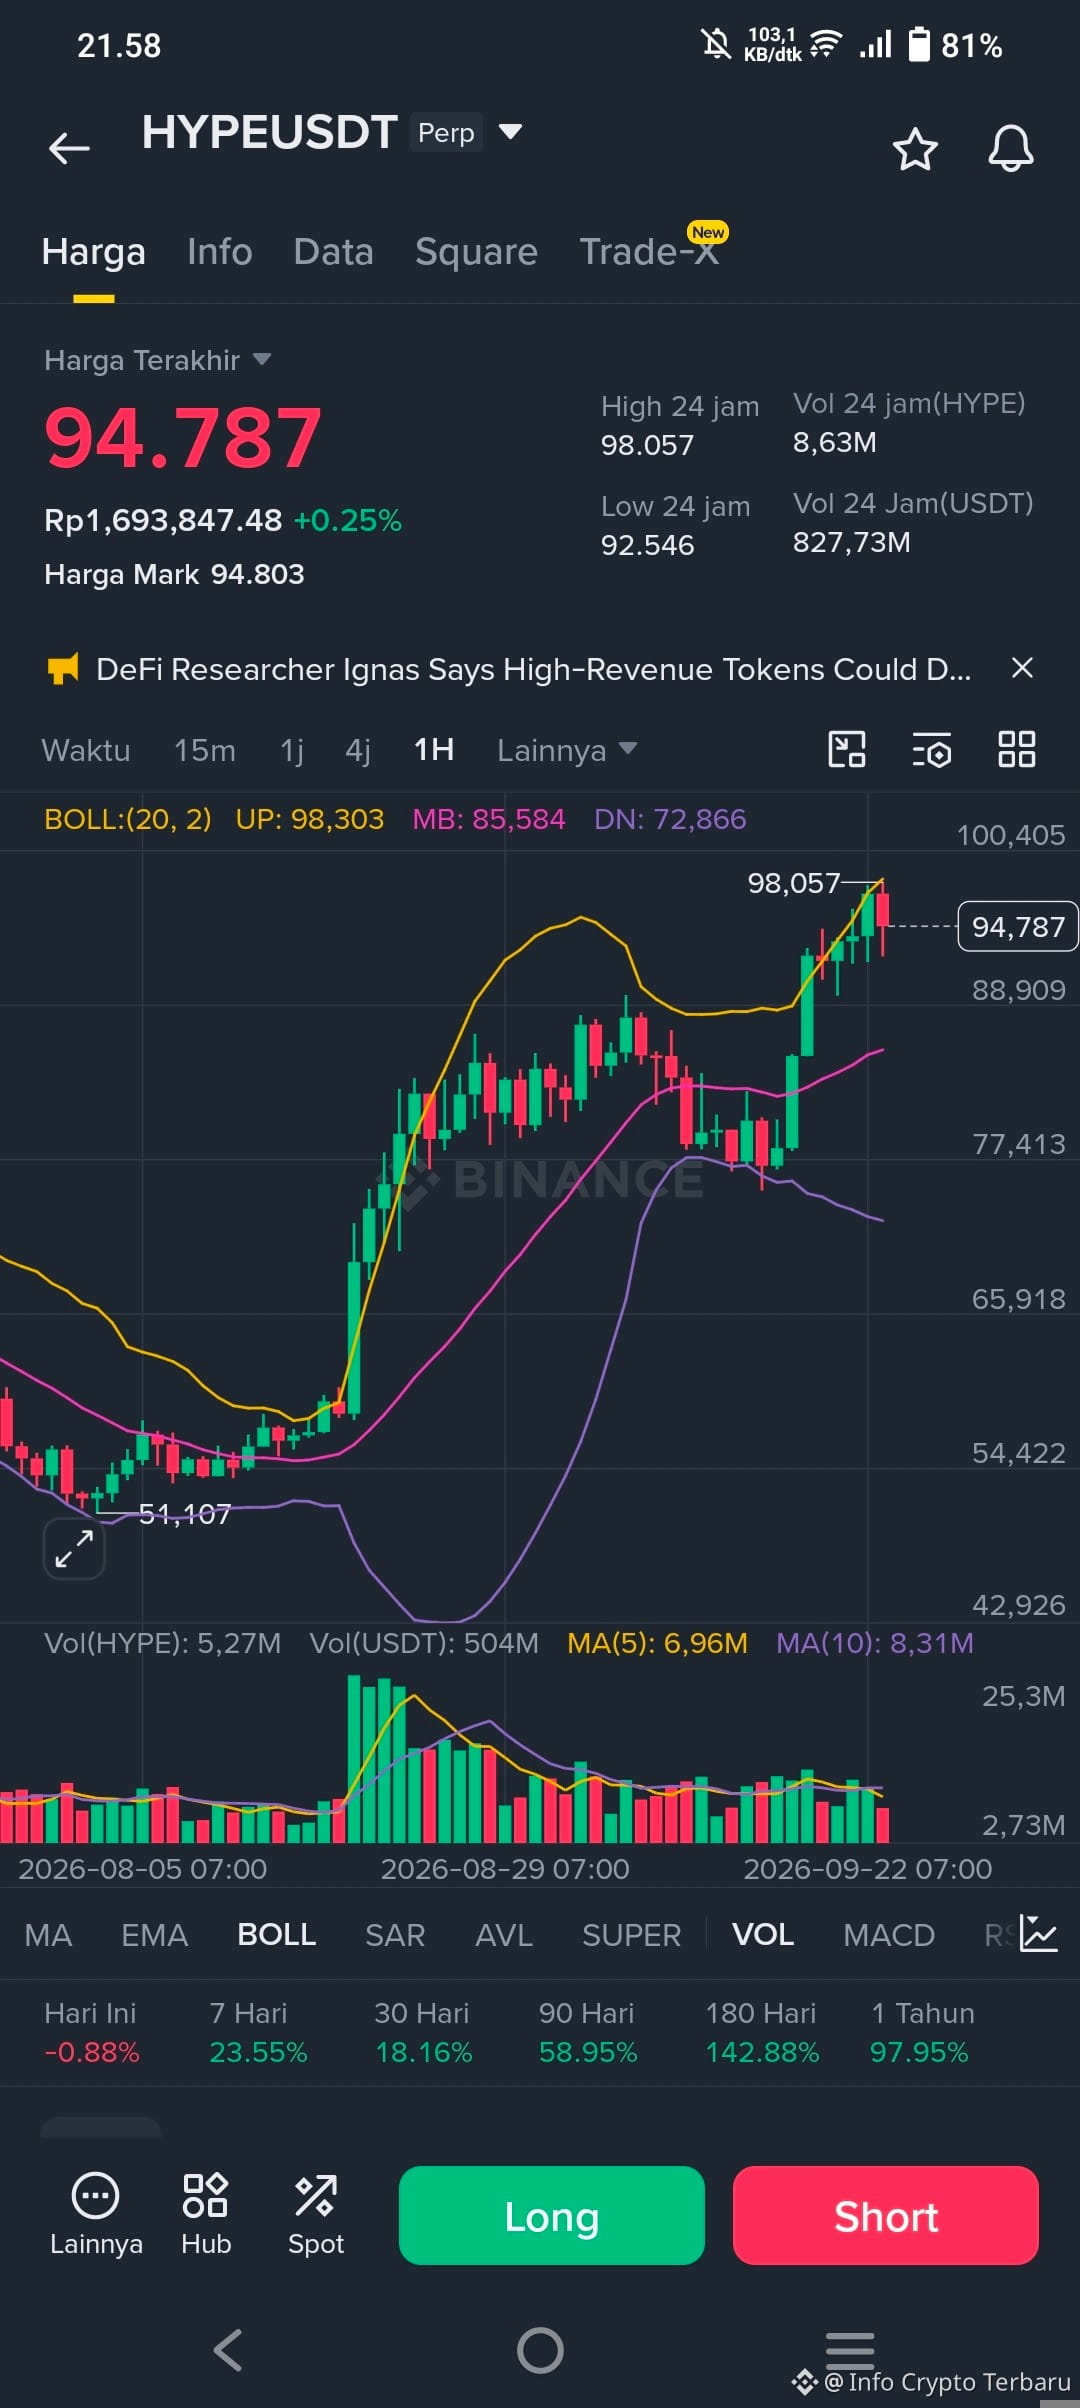
Will $HYPE Continue the Upswing❓❓❓❓
Hyperliquid is trading around US$94.78 at the time this news was written on Wednesday, maintaining a strong bullish bias after a 20% rally last week.
📈HYPE continues its rise well above the 50-, 100-, and 200-period Exponential Moving Averages (EMAs) on the four-hour chart at US$90.07, US$86.60, and US$81.75, all of which support the long-term bullish bias.
🔥From a technical perspective, the Fibonacci retracement of the latest move from US$75.21 to US$94.55 shows Fibonacci Extension levels of 127.2% and 161.8% at US$99.81 and US$106.50, respectively, as the next major hurdles.
📈Momentum is constructive but not extreme, as the Relative Strength Index (RSI) near 68 on the four-hour chart is just below the overbought area. At the same time, the Moving Average Convergence Divergence (MACD) is flat just below its signal line, hinting at a consolidative pause.
⛔On the downside, initial support is seen at the Fibonacci anchor near US$94.55, followed by the 78.6% retracement at US$90.41, which aligns with the 50-period EMA at US$90.07 to form a strong demand zone during pullbacks.
#AIStocksWhatNext #DollarIndexReclaims101
$FARTCOIN $COW
Hyperliquid is trading around US$94.78 at the time this news was written on Wednesday, maintaining a strong bullish bias after a 20% rally last week.
📈HYPE continues its rise well above the 50-, 100-, and 200-period Exponential Moving Averages (EMAs) on the four-hour chart at US$90.07, US$86.60, and US$81.75, all of which support the long-term bullish bias.
🔥From a technical perspective, the Fibonacci retracement of the latest move from US$75.21 to US$94.55 shows Fibonacci Extension levels of 127.2% and 161.8% at US$99.81 and US$106.50, respectively, as the next major hurdles.
📈Momentum is constructive but not extreme, as the Relative Strength Index (RSI) near 68 on the four-hour chart is just below the overbought area. At the same time, the Moving Average Convergence Divergence (MACD) is flat just below its signal line, hinting at a consolidative pause.
⛔On the downside, initial support is seen at the Fibonacci anchor near US$94.55, followed by the 78.6% retracement at US$90.41, which aligns with the 50-period EMA at US$90.07 to form a strong demand zone during pullbacks.
#AIStocksWhatNext #DollarIndexReclaims101
$FARTCOIN $COW