$1000XEC
/USDT - 0,00000890: The Pump Is Done After the “Peak Pump” Phase, Ready for a Short Squeeze?
XEC is skyrocketing from 0,00000476 to 0,00001095 in 1 month. Now it’s in the phase of exhaling/bleeding.
MTF Analysis (Multi Timeframe)
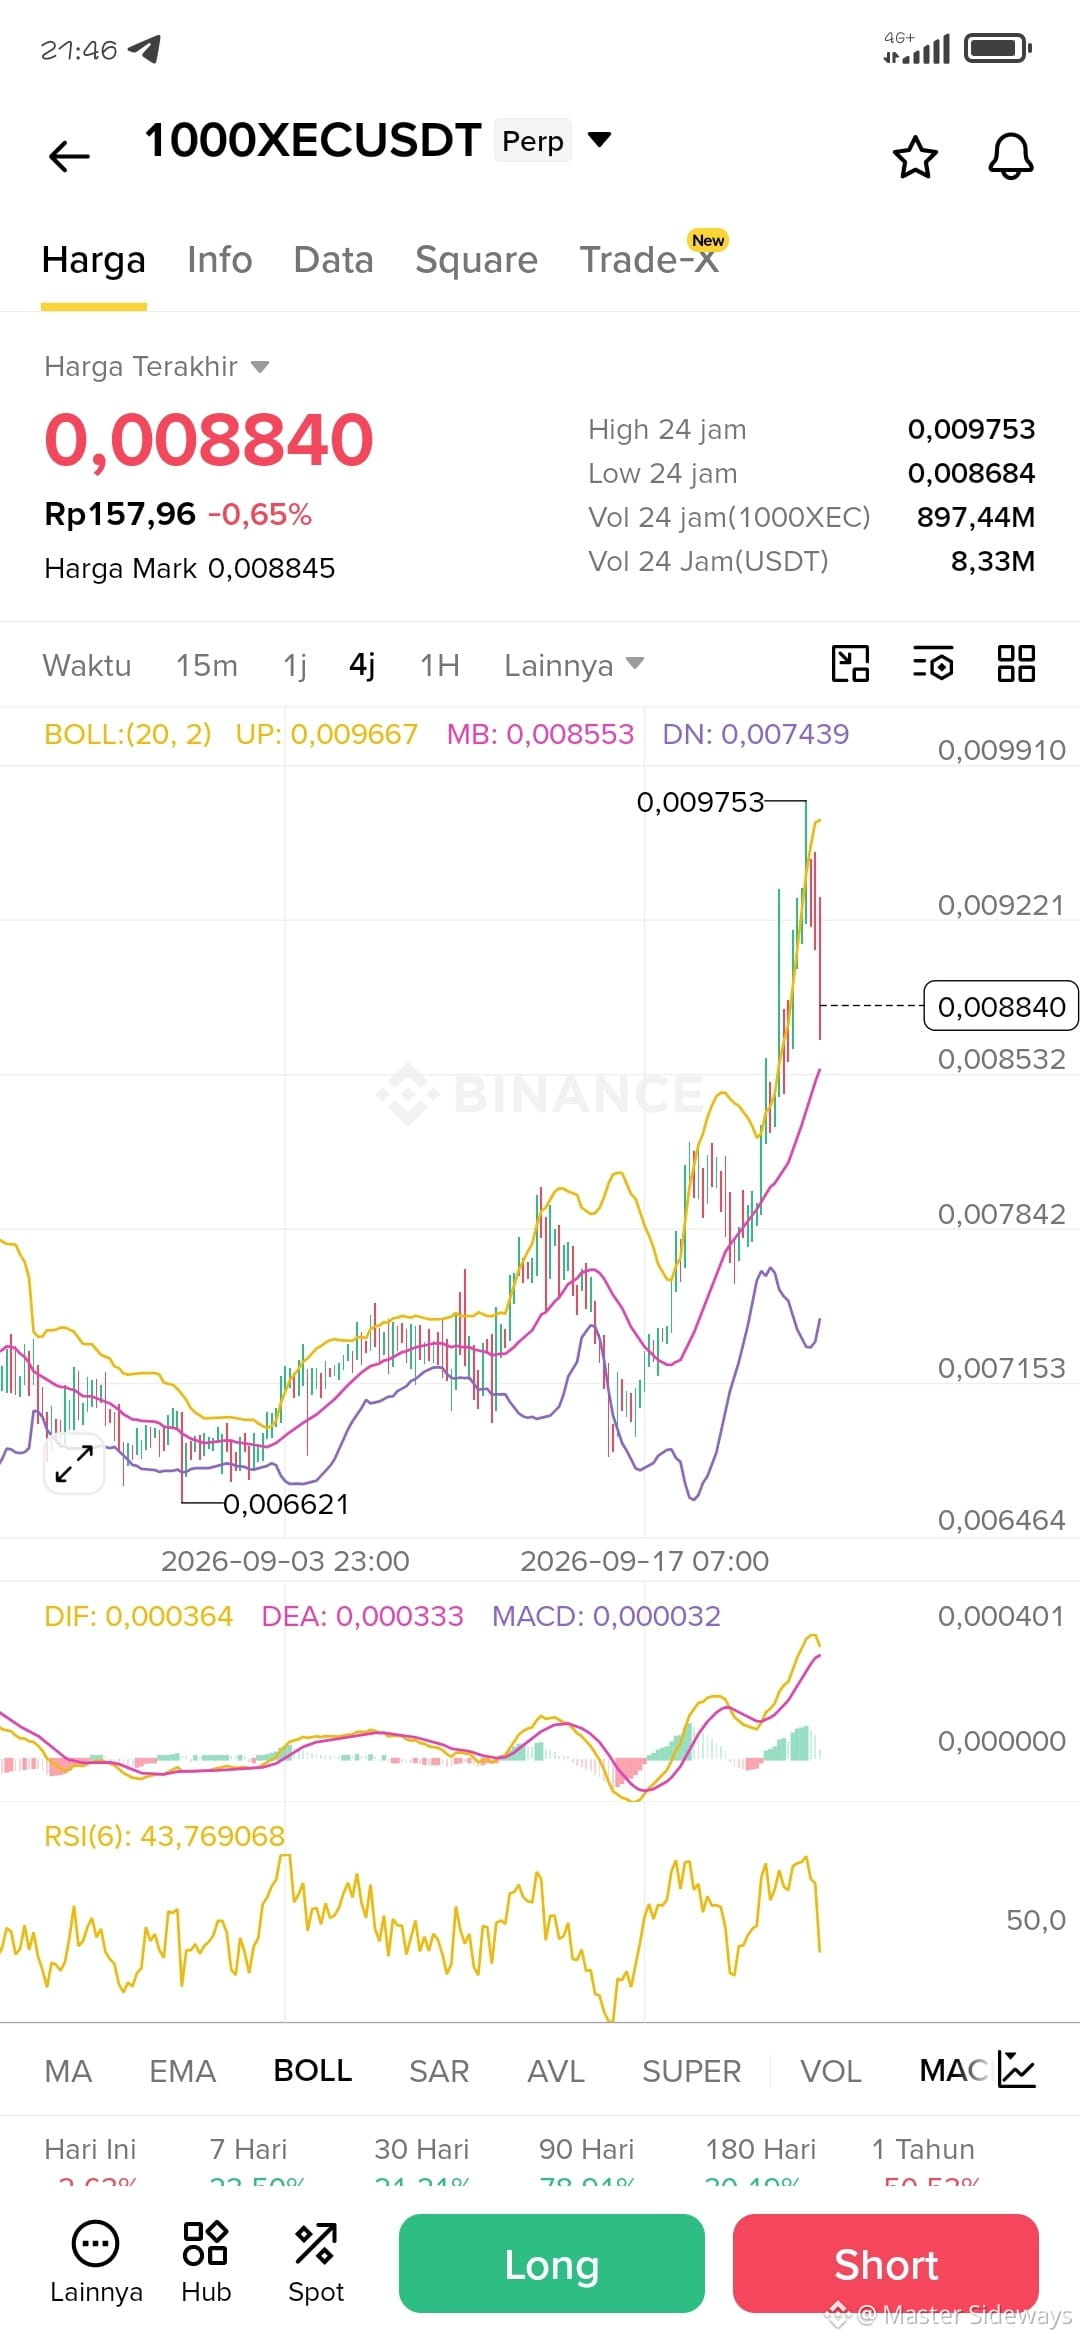
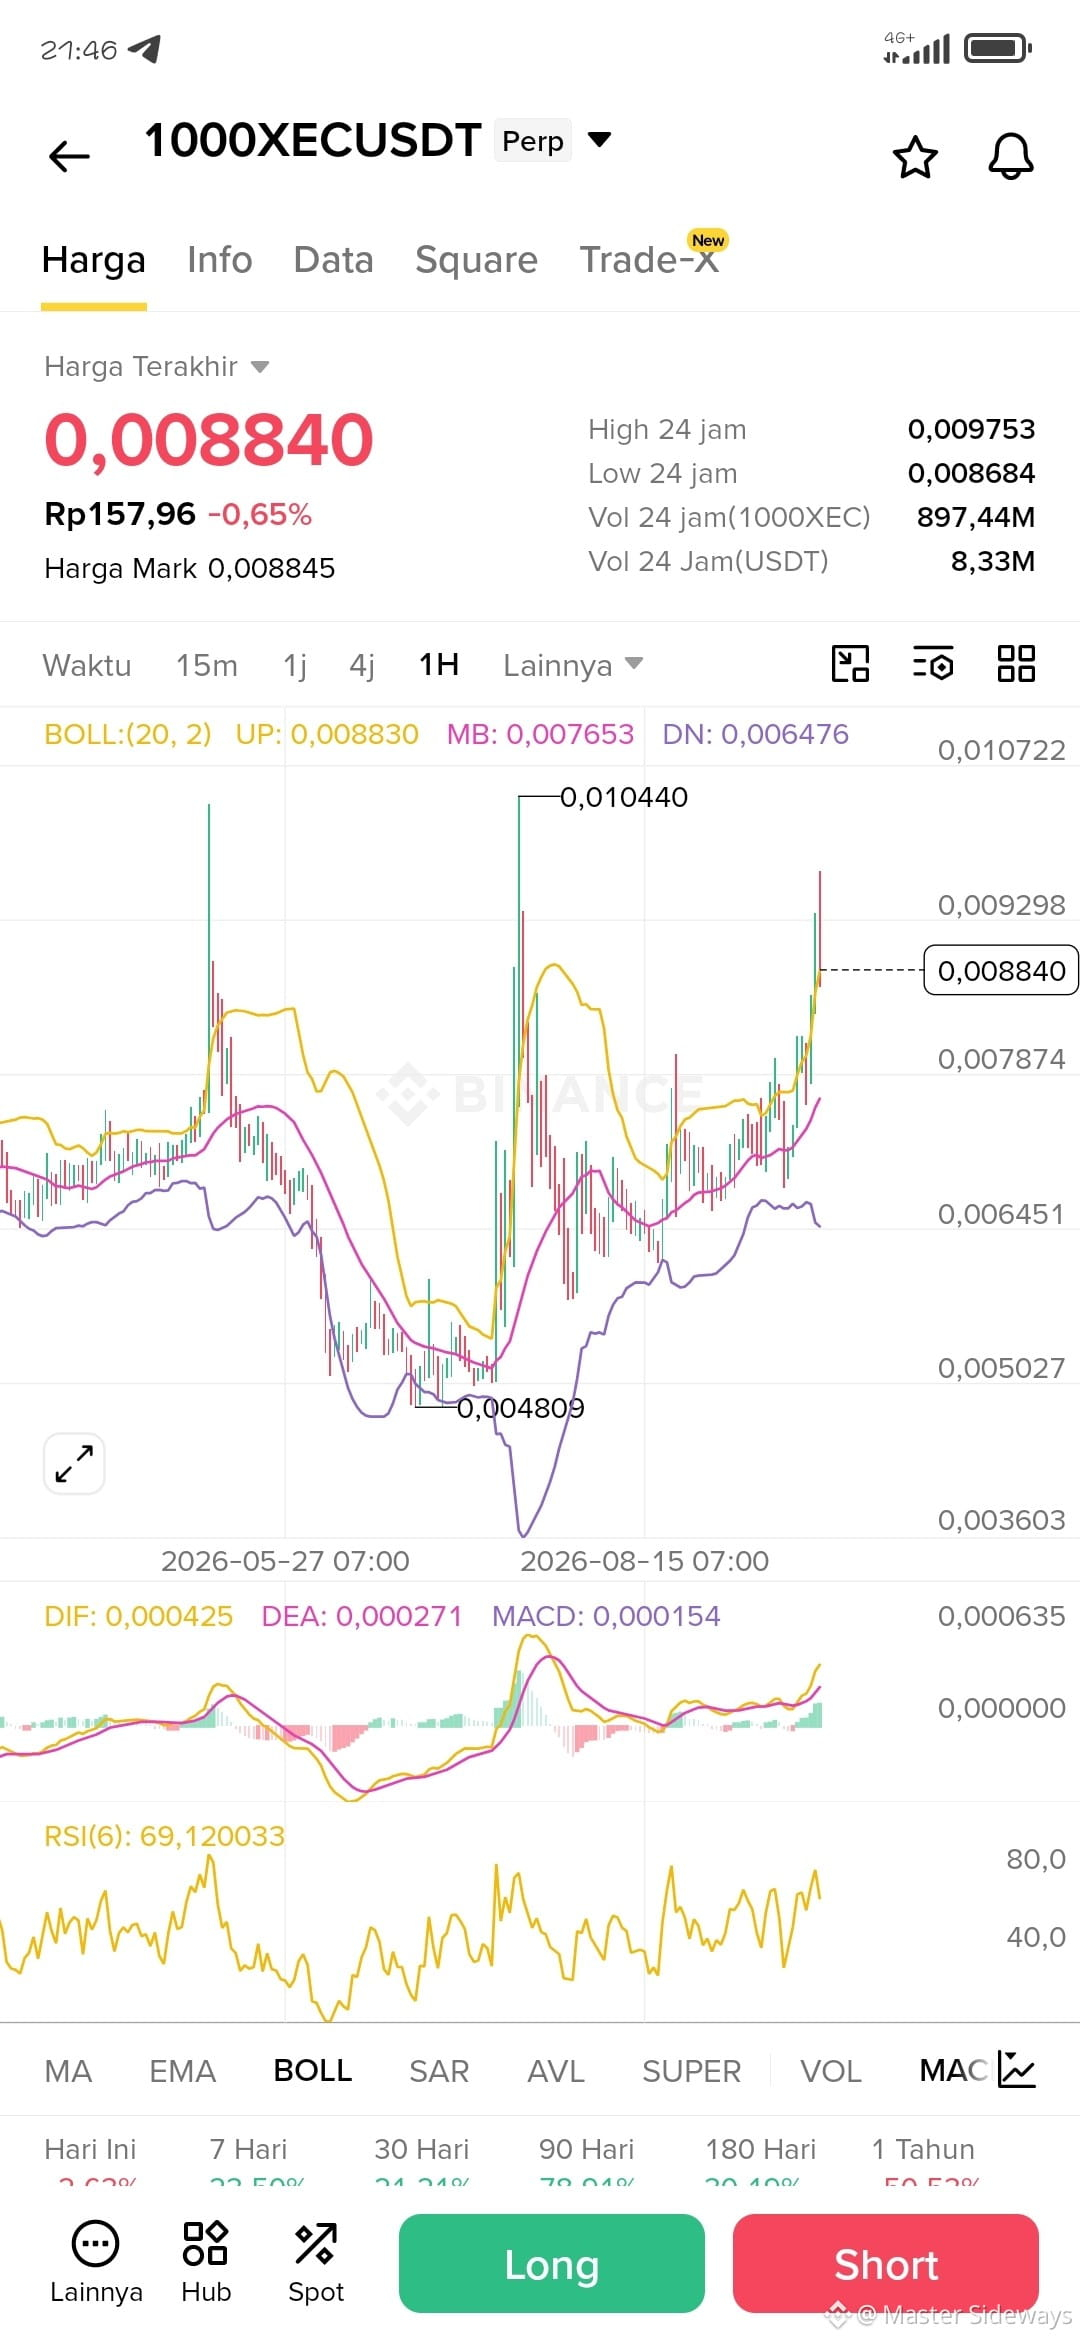
1. 1H & 4H = Distribution Peak
Price failed to hold above 0,00000972 (High over 24h). On the 4H timeframe, price is still above the 4H MB Bollinger 0,00000856, but the candles have started becoming smaller on top. RSI 4H is 46.2 → buying momentum is weakening. This is no longer the FOMO Long area.
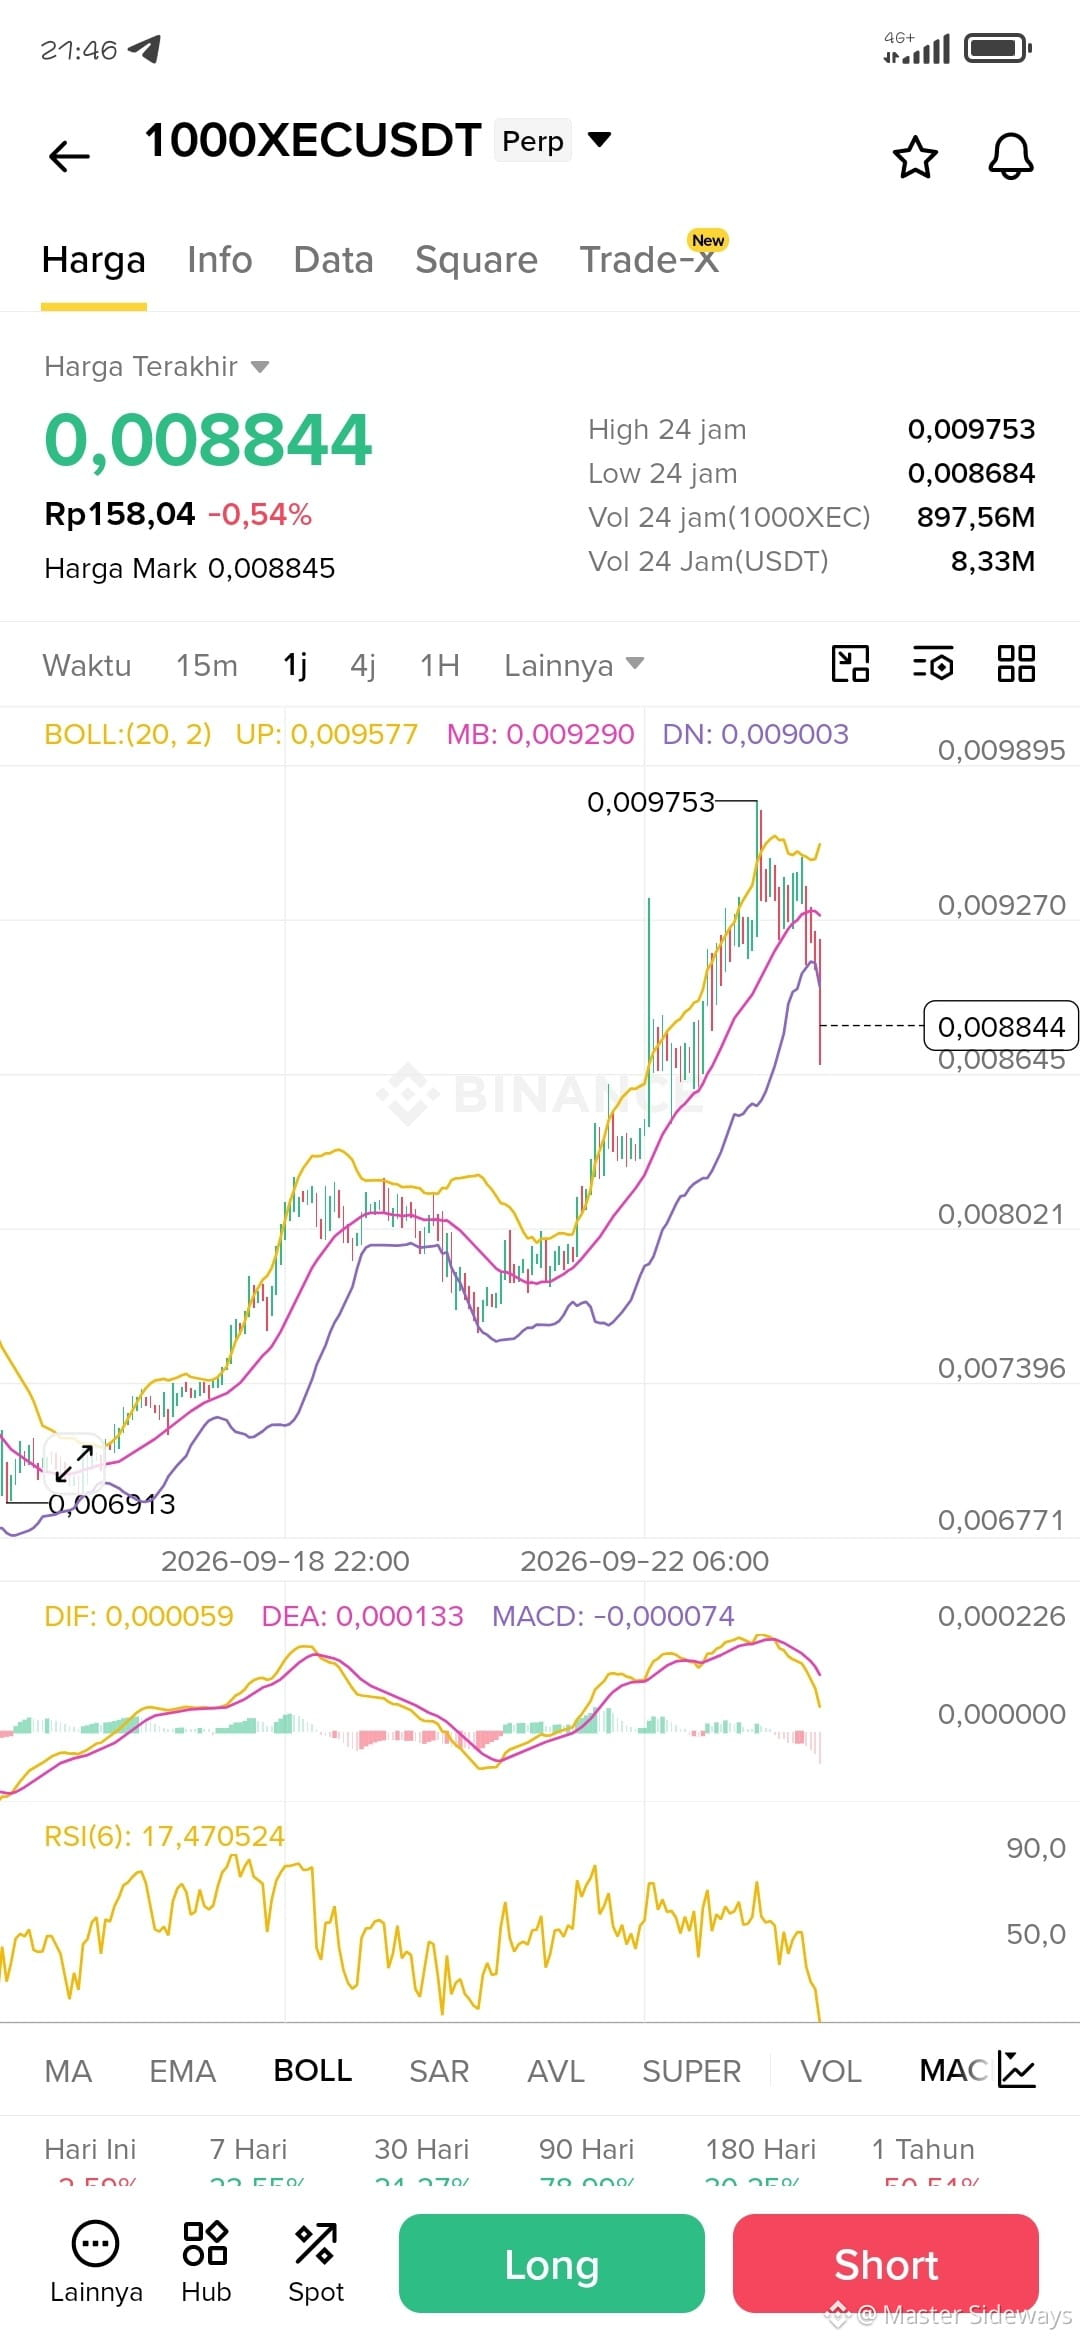
2. 1D = Warning of a Deeper Correction
This is the most important part. On the 1D timeframe, your RSI(6) is only 20.88! And MACD is already negative at -0.00000007. That means, on the daily chart, XEC has entered a correction phase. The next strong support is at 0,00000745 (Lower Bollinger 4H), which happens to be close to your average price of 0,00000717.
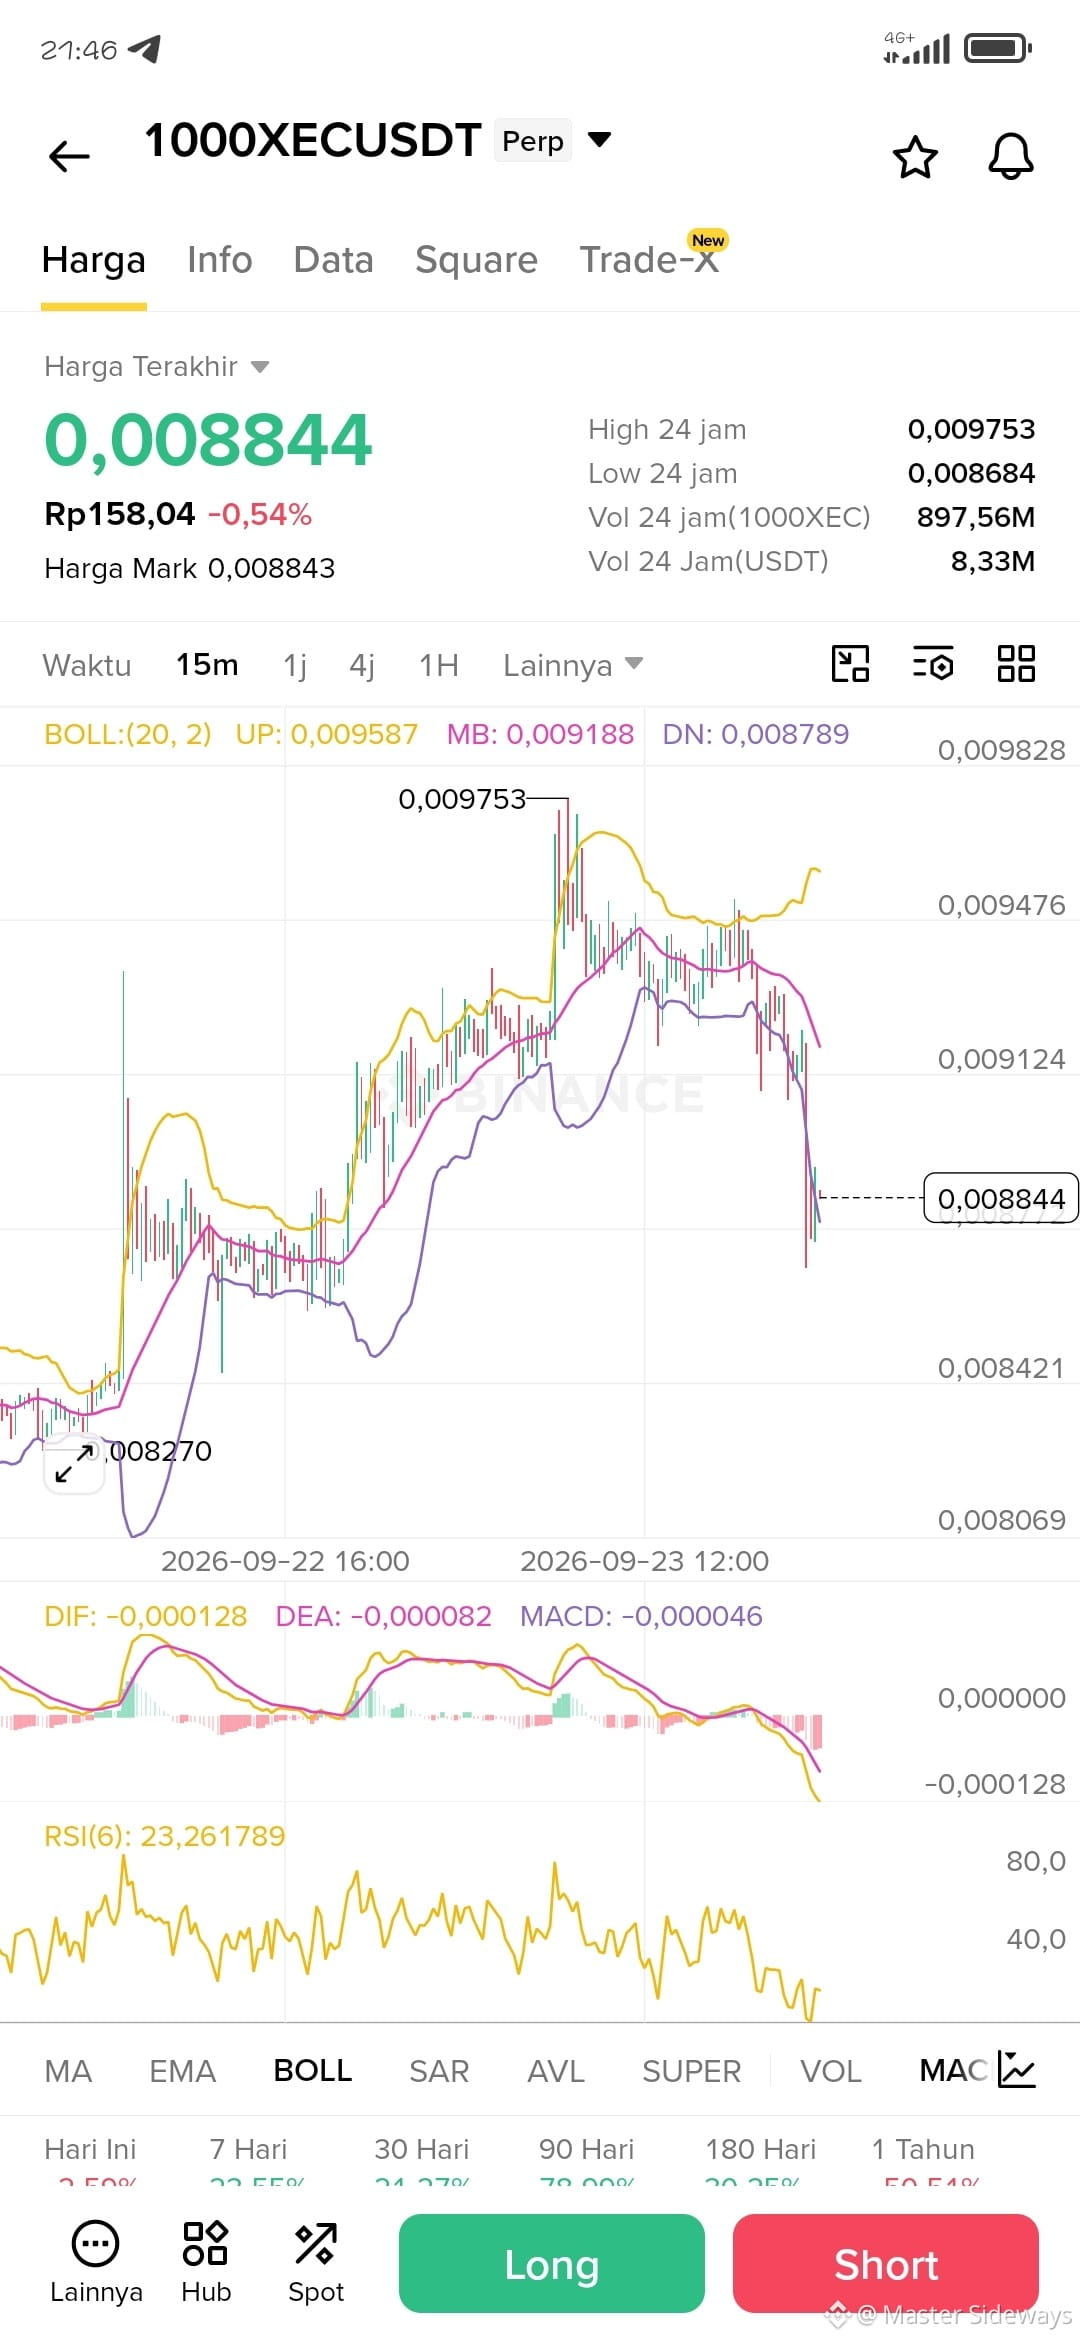
*3. 15M = Scalp Opportunity
The 15M timeframe has already broken down. Price at 0,00000890 has pierced the Middle Bollinger 0,00000922 and is now pressing down toward the Lower Band 0,00000885. MACD -0,00000004 is red, RSI 29.7 is near oversold.
Futures Setup (EDUCATION, NOT FINANCIAL ADVICE)
Bias: Bearish in the short term, bullish in the medium term is still possible.
SCENARIO A - SHORT SCALP (High Risk):
Entry area: 0,00000910 - 0,00000922 (Retest MB 15M)
Target: 0,00000871 (Low over 24h) - 0,00000850
Stop Loss: Above 0,00000972
Don’t use leverage >10x for micro-cap coins like XEC
SCENARIO B - LONG ON DIP (More Patient):
Wait for confirmation: XEC holds above 0,00000871 + RSI 15M bounces back to 40+
Target: 0,00000955 - 0,00000972
Invalid if it breaks below 0,00000850
24h Volume is 1.96M USDT, which is thin. That means the move may be volatile and prone to wick spikes.
Do you think XEC will retest 0,00000717 first, or will it immediately make a new ATH at 0,00001126?
#XEC #eCash #CryptoIndonesia #futures
/USDT - 0,00000890: The Pump Is Done After the “Peak Pump” Phase, Ready for a Short Squeeze?
XEC is skyrocketing from 0,00000476 to 0,00001095 in 1 month. Now it’s in the phase of exhaling/bleeding.
MTF Analysis (Multi Timeframe)
1. 1H & 4H = Distribution Peak
Price failed to hold above 0,00000972 (High over 24h). On the 4H timeframe, price is still above the 4H MB Bollinger 0,00000856, but the candles have started becoming smaller on top. RSI 4H is 46.2 → buying momentum is weakening. This is no longer the FOMO Long area.
2. 1D = Warning of a Deeper Correction
This is the most important part. On the 1D timeframe, your RSI(6) is only 20.88! And MACD is already negative at -0.00000007. That means, on the daily chart, XEC has entered a correction phase. The next strong support is at 0,00000745 (Lower Bollinger 4H), which happens to be close to your average price of 0,00000717.
*3. 15M = Scalp Opportunity
The 15M timeframe has already broken down. Price at 0,00000890 has pierced the Middle Bollinger 0,00000922 and is now pressing down toward the Lower Band 0,00000885. MACD -0,00000004 is red, RSI 29.7 is near oversold.
Futures Setup (EDUCATION, NOT FINANCIAL ADVICE)
Bias: Bearish in the short term, bullish in the medium term is still possible.
SCENARIO A - SHORT SCALP (High Risk):
Entry area: 0,00000910 - 0,00000922 (Retest MB 15M)
Target: 0,00000871 (Low over 24h) - 0,00000850
Stop Loss: Above 0,00000972
Don’t use leverage >10x for micro-cap coins like XEC
SCENARIO B - LONG ON DIP (More Patient):
Wait for confirmation: XEC holds above 0,00000871 + RSI 15M bounces back to 40+
Target: 0,00000955 - 0,00000972
Invalid if it breaks below 0,00000850
24h Volume is 1.96M USDT, which is thin. That means the move may be volatile and prone to wick spikes.
Do you think XEC will retest 0,00000717 first, or will it immediately make a new ATH at 0,00001126?
#XEC #eCash #CryptoIndonesia #futures