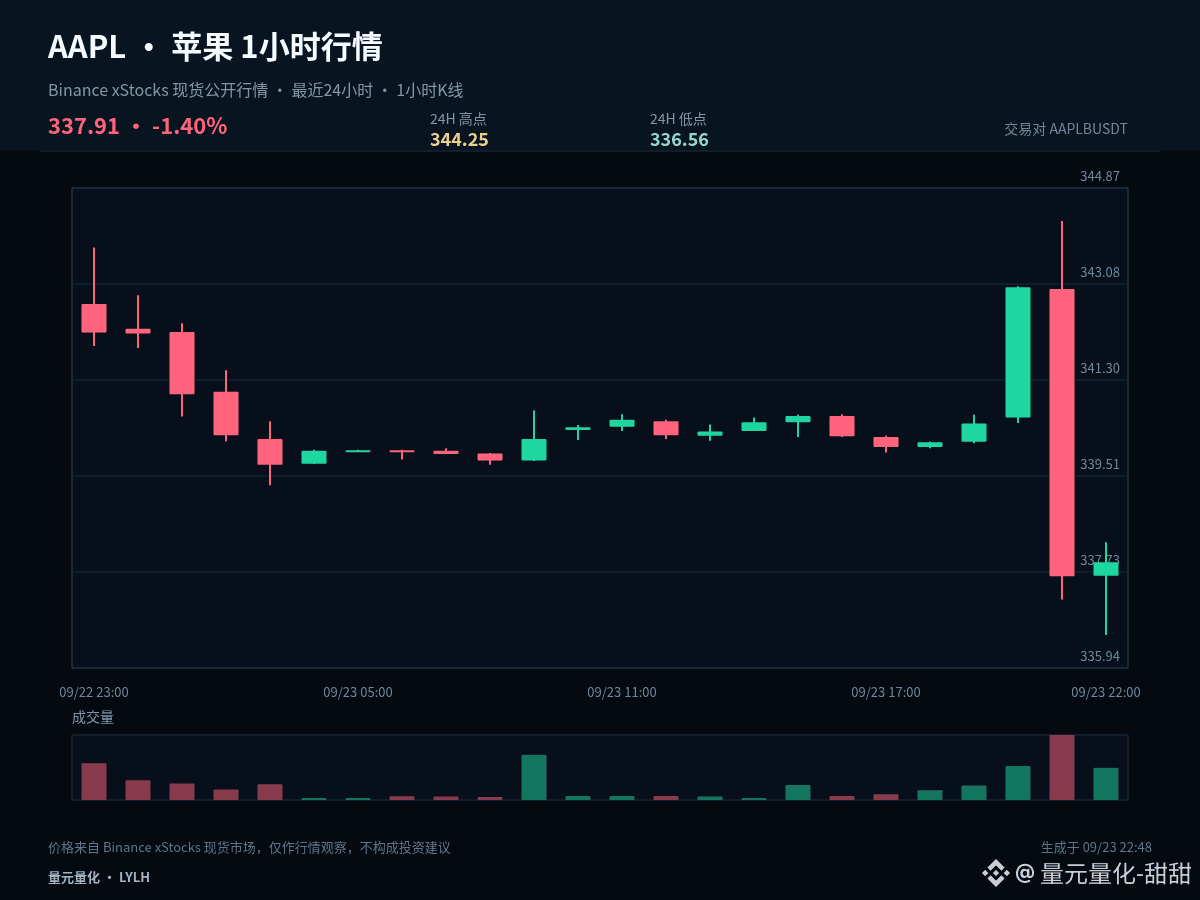
$AAPLB #AAPL It’s currently more like interval-based rotation and turnover. There’s no need to interpret every single 1-hour candlestick as a brand-new trend. Current price is 337.91, 1 hour +0.08%, 24 hours -1.00%.
The current price is hovering near the lower end of the past 24-hour range—up 0.08% in the last hour and down 1.00% over 24 hours. The core of analyzing the lower area isn’t to bottom-fish in advance; it’s to observe whether it can quickly reclaim after a breakdown. If it can reclaim, that indicates sell pressure has been absorbed. If it keeps lingering below the lower end, it suggests weakness hasn’t ended.
For the range: the upper boundary is 344.25, the lower boundary is 336.56, and the midline is 340.405. Near the upper boundary, watch for the quality of any breakout. Near the lower boundary, watch for the strength of the rebound/acceptance. Around the midline, reduce the frequency of trades, because it isn’t far enough from either side to make direction and risk-reward unclear.
The signals truly worth acting on are: after breaking a boundary, price is willing to stay inside the new range; or after probing a boundary downward, it quickly reclaims. Without such confirmation, continue to treat it as a range/trading range—don’t let brief intraday fluctuations change the overall plan.
Position management should distinguish between medium-term and short-term trades. For existing medium-term positions, first check whether the structure has been broken; don’t get repeatedly influenced by single 1-hour candlesticks. Short-term positions should be executed around support, resistance, and close confirmation. If you’re in cash, there’s no need to chase the price in the middle of the range—waiting for a clearer location usually offers an advantage.
Your trading plan must include invalidation conditions. When you’re right, you can realize profits in stages. When you’re wrong, you must allow yourself to exit—don’t use adding to positions to cover up the fact that the original logic has changed. The market will update, and your viewpoint should adjust along with the price evidence.
#CardanoJoinsX402PaymentStandard
The current price is hovering near the lower end of the past 24-hour range—up 0.08% in the last hour and down 1.00% over 24 hours. The core of analyzing the lower area isn’t to bottom-fish in advance; it’s to observe whether it can quickly reclaim after a breakdown. If it can reclaim, that indicates sell pressure has been absorbed. If it keeps lingering below the lower end, it suggests weakness hasn’t ended.
For the range: the upper boundary is 344.25, the lower boundary is 336.56, and the midline is 340.405. Near the upper boundary, watch for the quality of any breakout. Near the lower boundary, watch for the strength of the rebound/acceptance. Around the midline, reduce the frequency of trades, because it isn’t far enough from either side to make direction and risk-reward unclear.
The signals truly worth acting on are: after breaking a boundary, price is willing to stay inside the new range; or after probing a boundary downward, it quickly reclaims. Without such confirmation, continue to treat it as a range/trading range—don’t let brief intraday fluctuations change the overall plan.
Position management should distinguish between medium-term and short-term trades. For existing medium-term positions, first check whether the structure has been broken; don’t get repeatedly influenced by single 1-hour candlesticks. Short-term positions should be executed around support, resistance, and close confirmation. If you’re in cash, there’s no need to chase the price in the middle of the range—waiting for a clearer location usually offers an advantage.
Your trading plan must include invalidation conditions. When you’re right, you can realize profits in stages. When you’re wrong, you must allow yourself to exit—don’t use adding to positions to cover up the fact that the original logic has changed. The market will update, and your viewpoint should adjust along with the price evidence.
#CardanoJoinsX402PaymentStandard