Trading Ideas|9/23 22:20
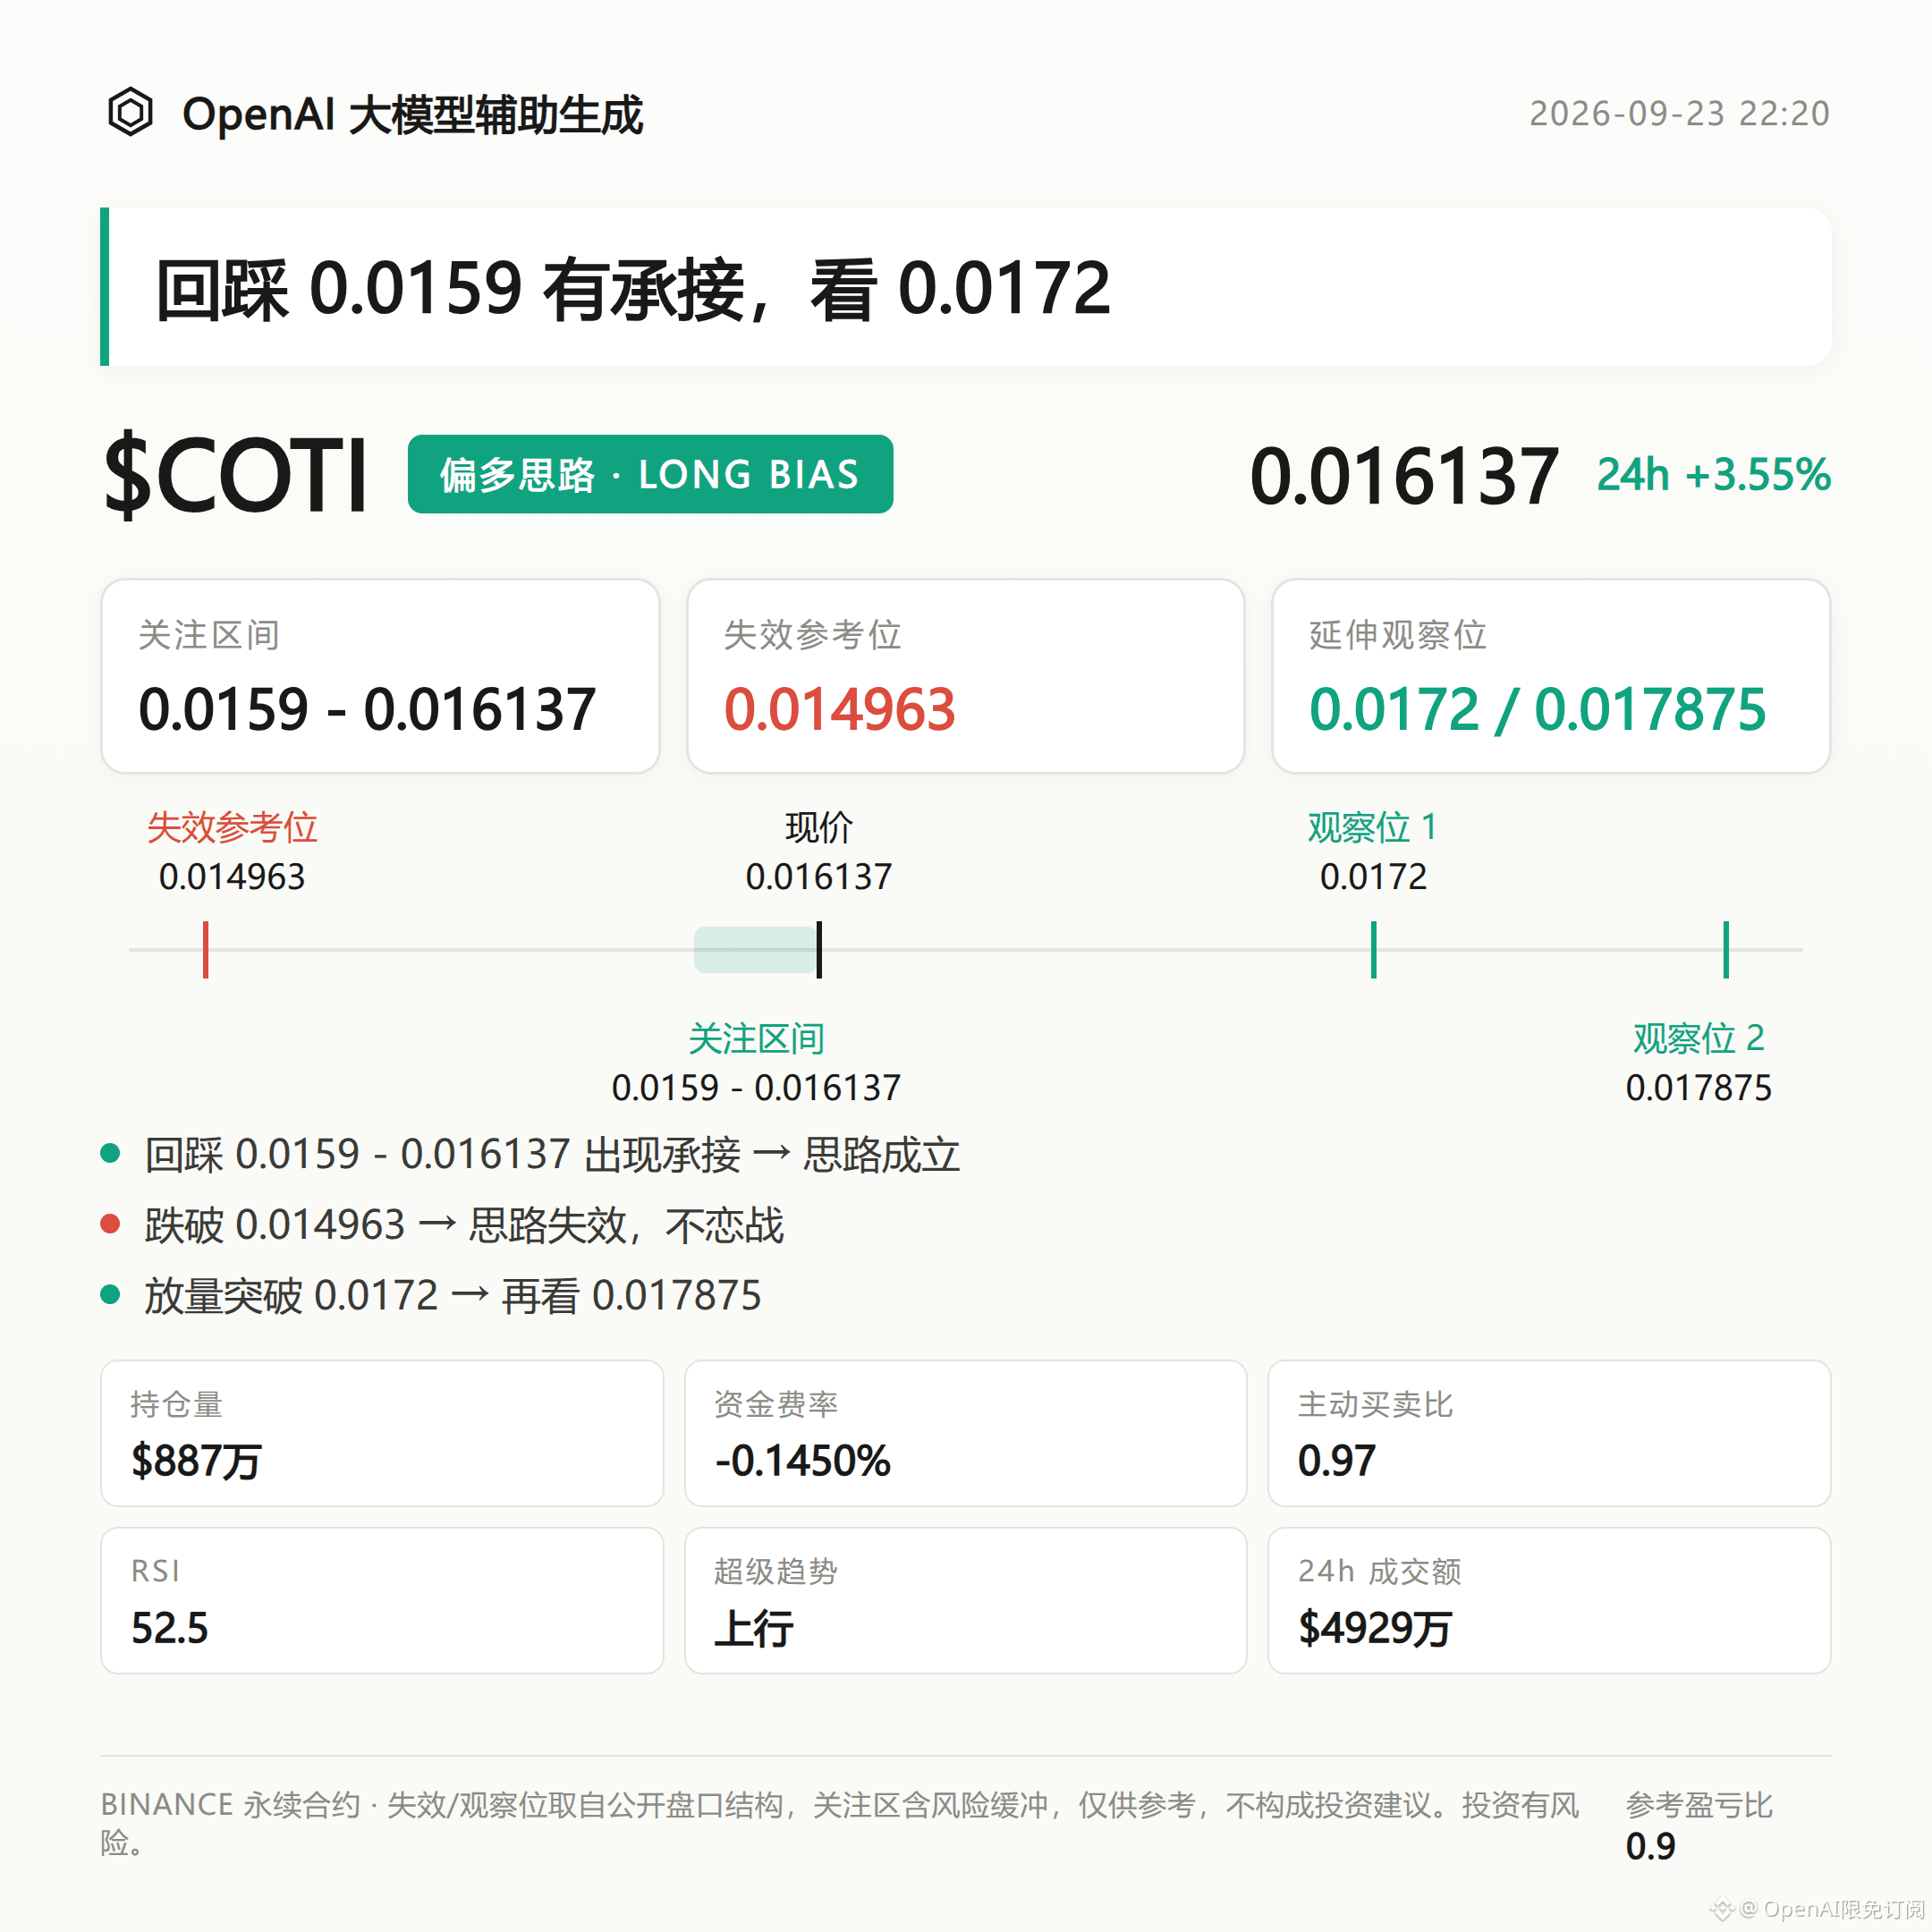
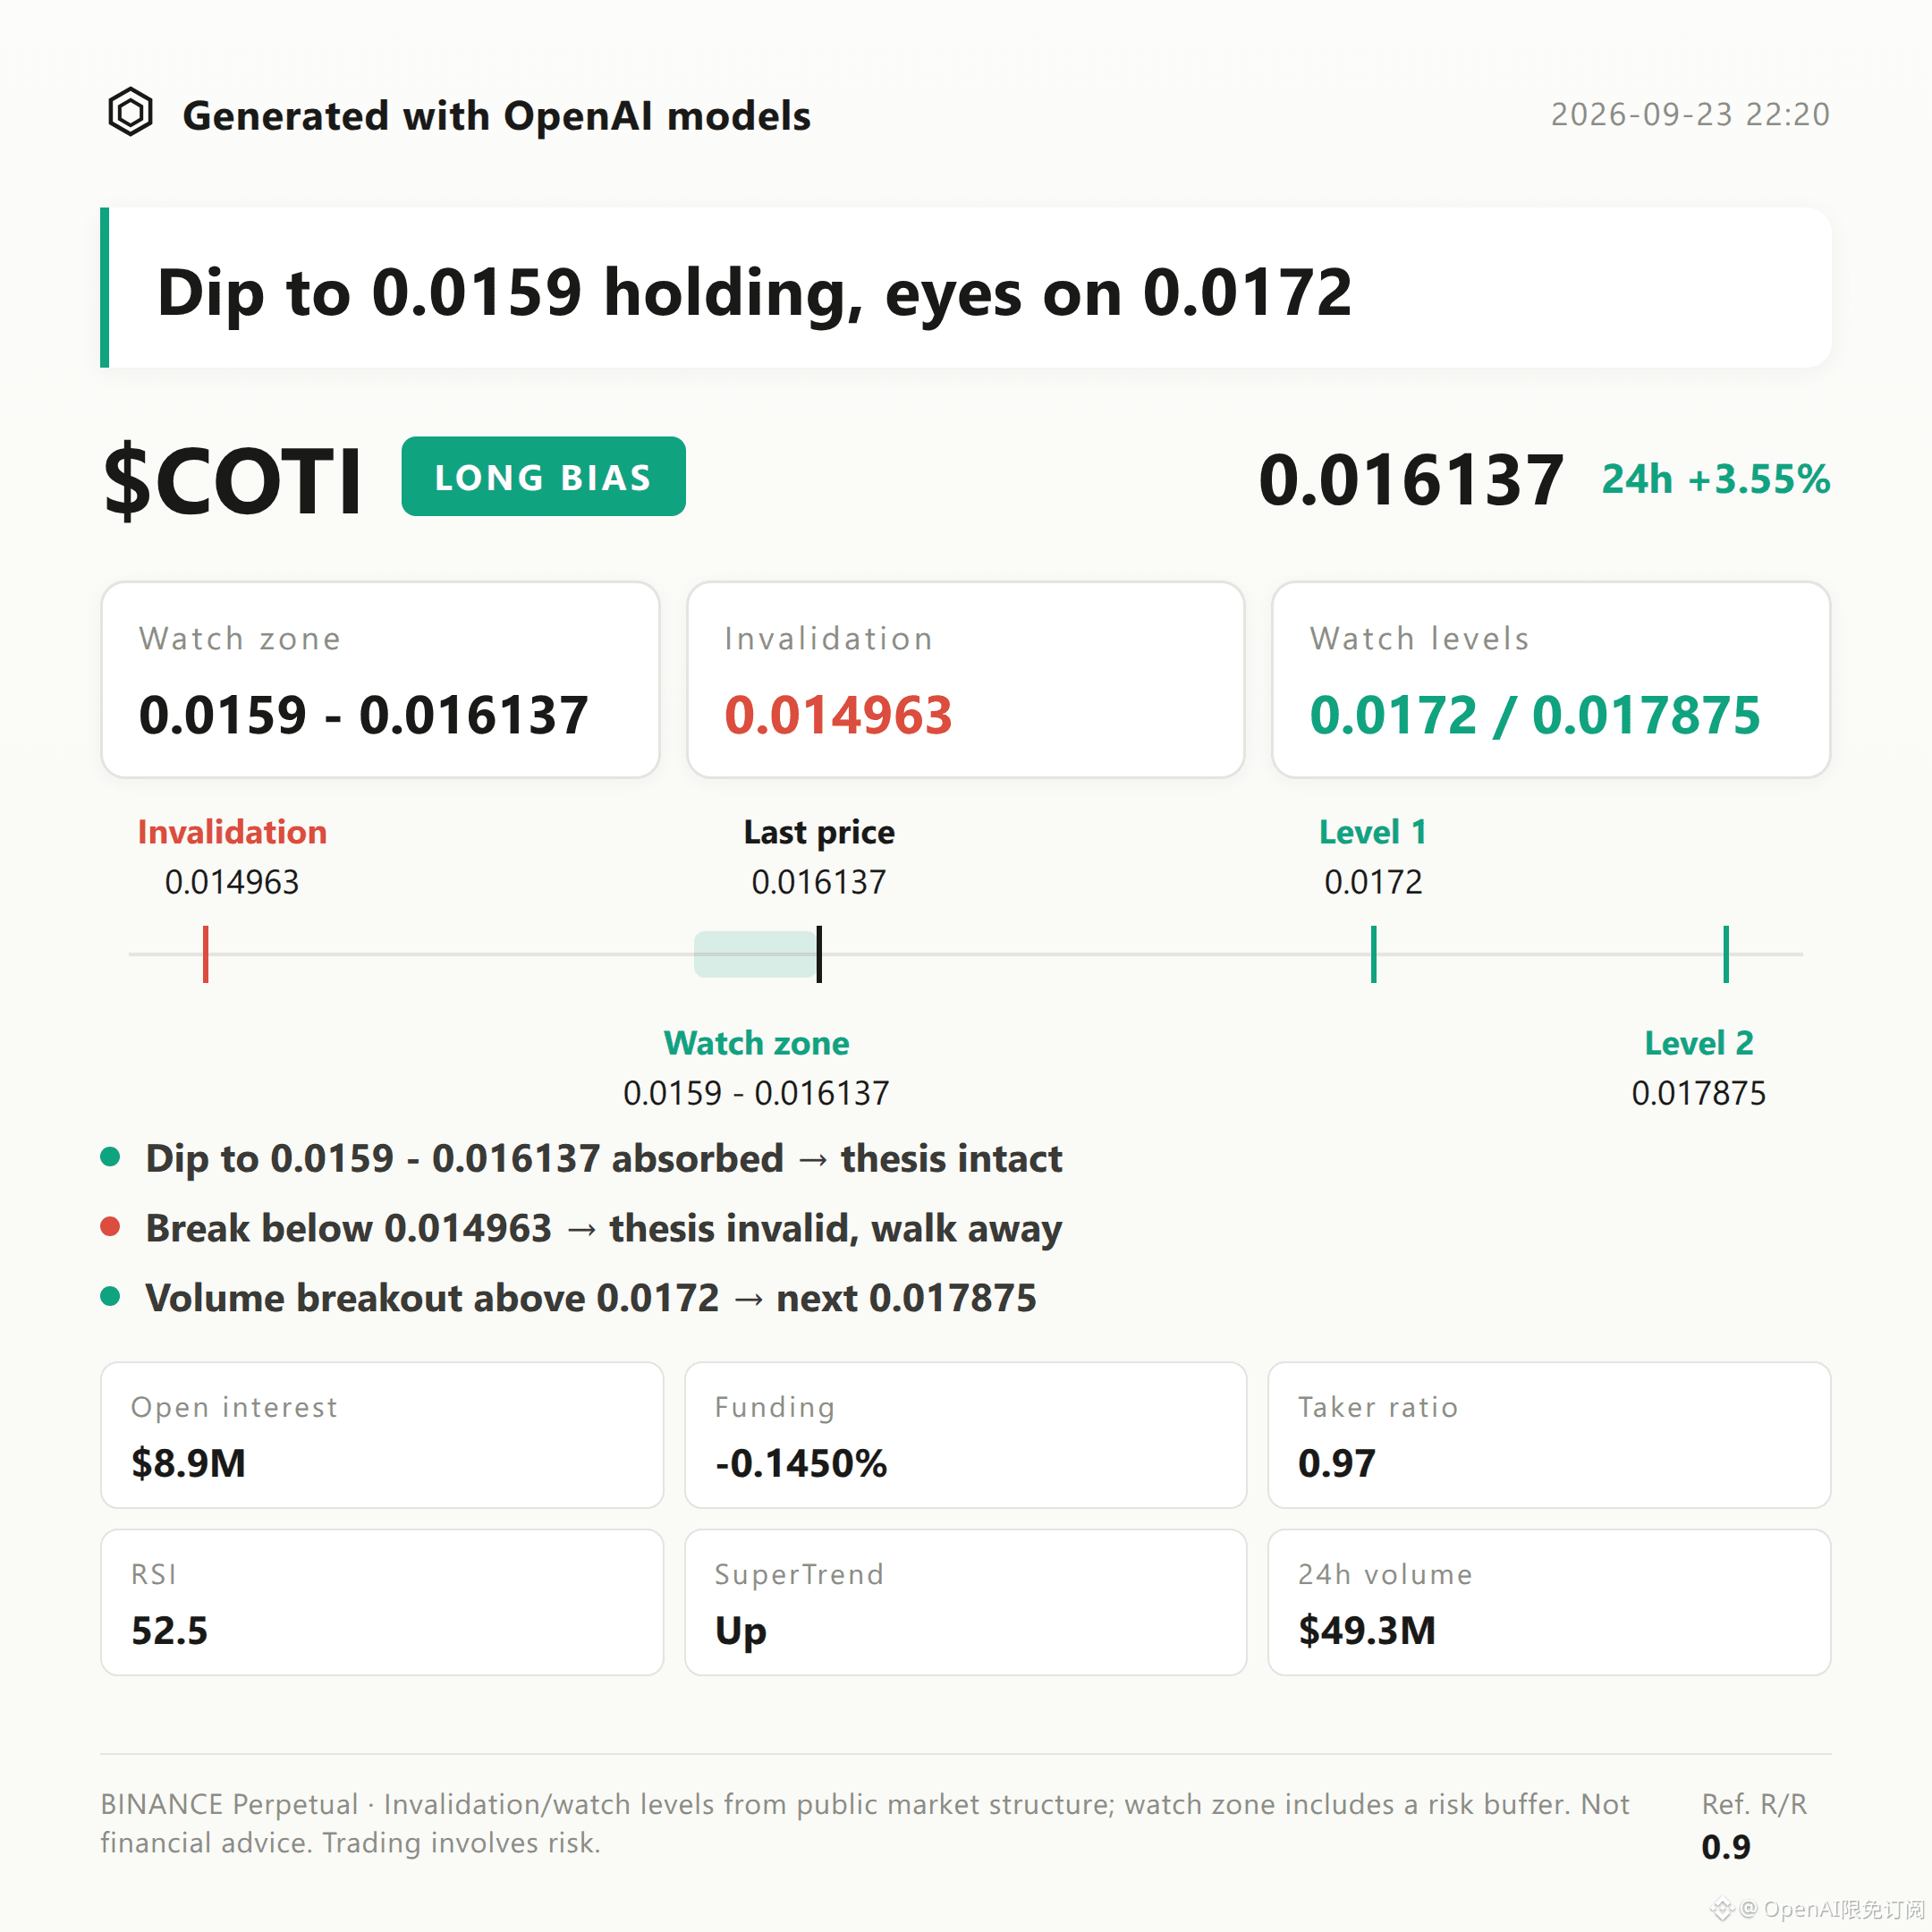
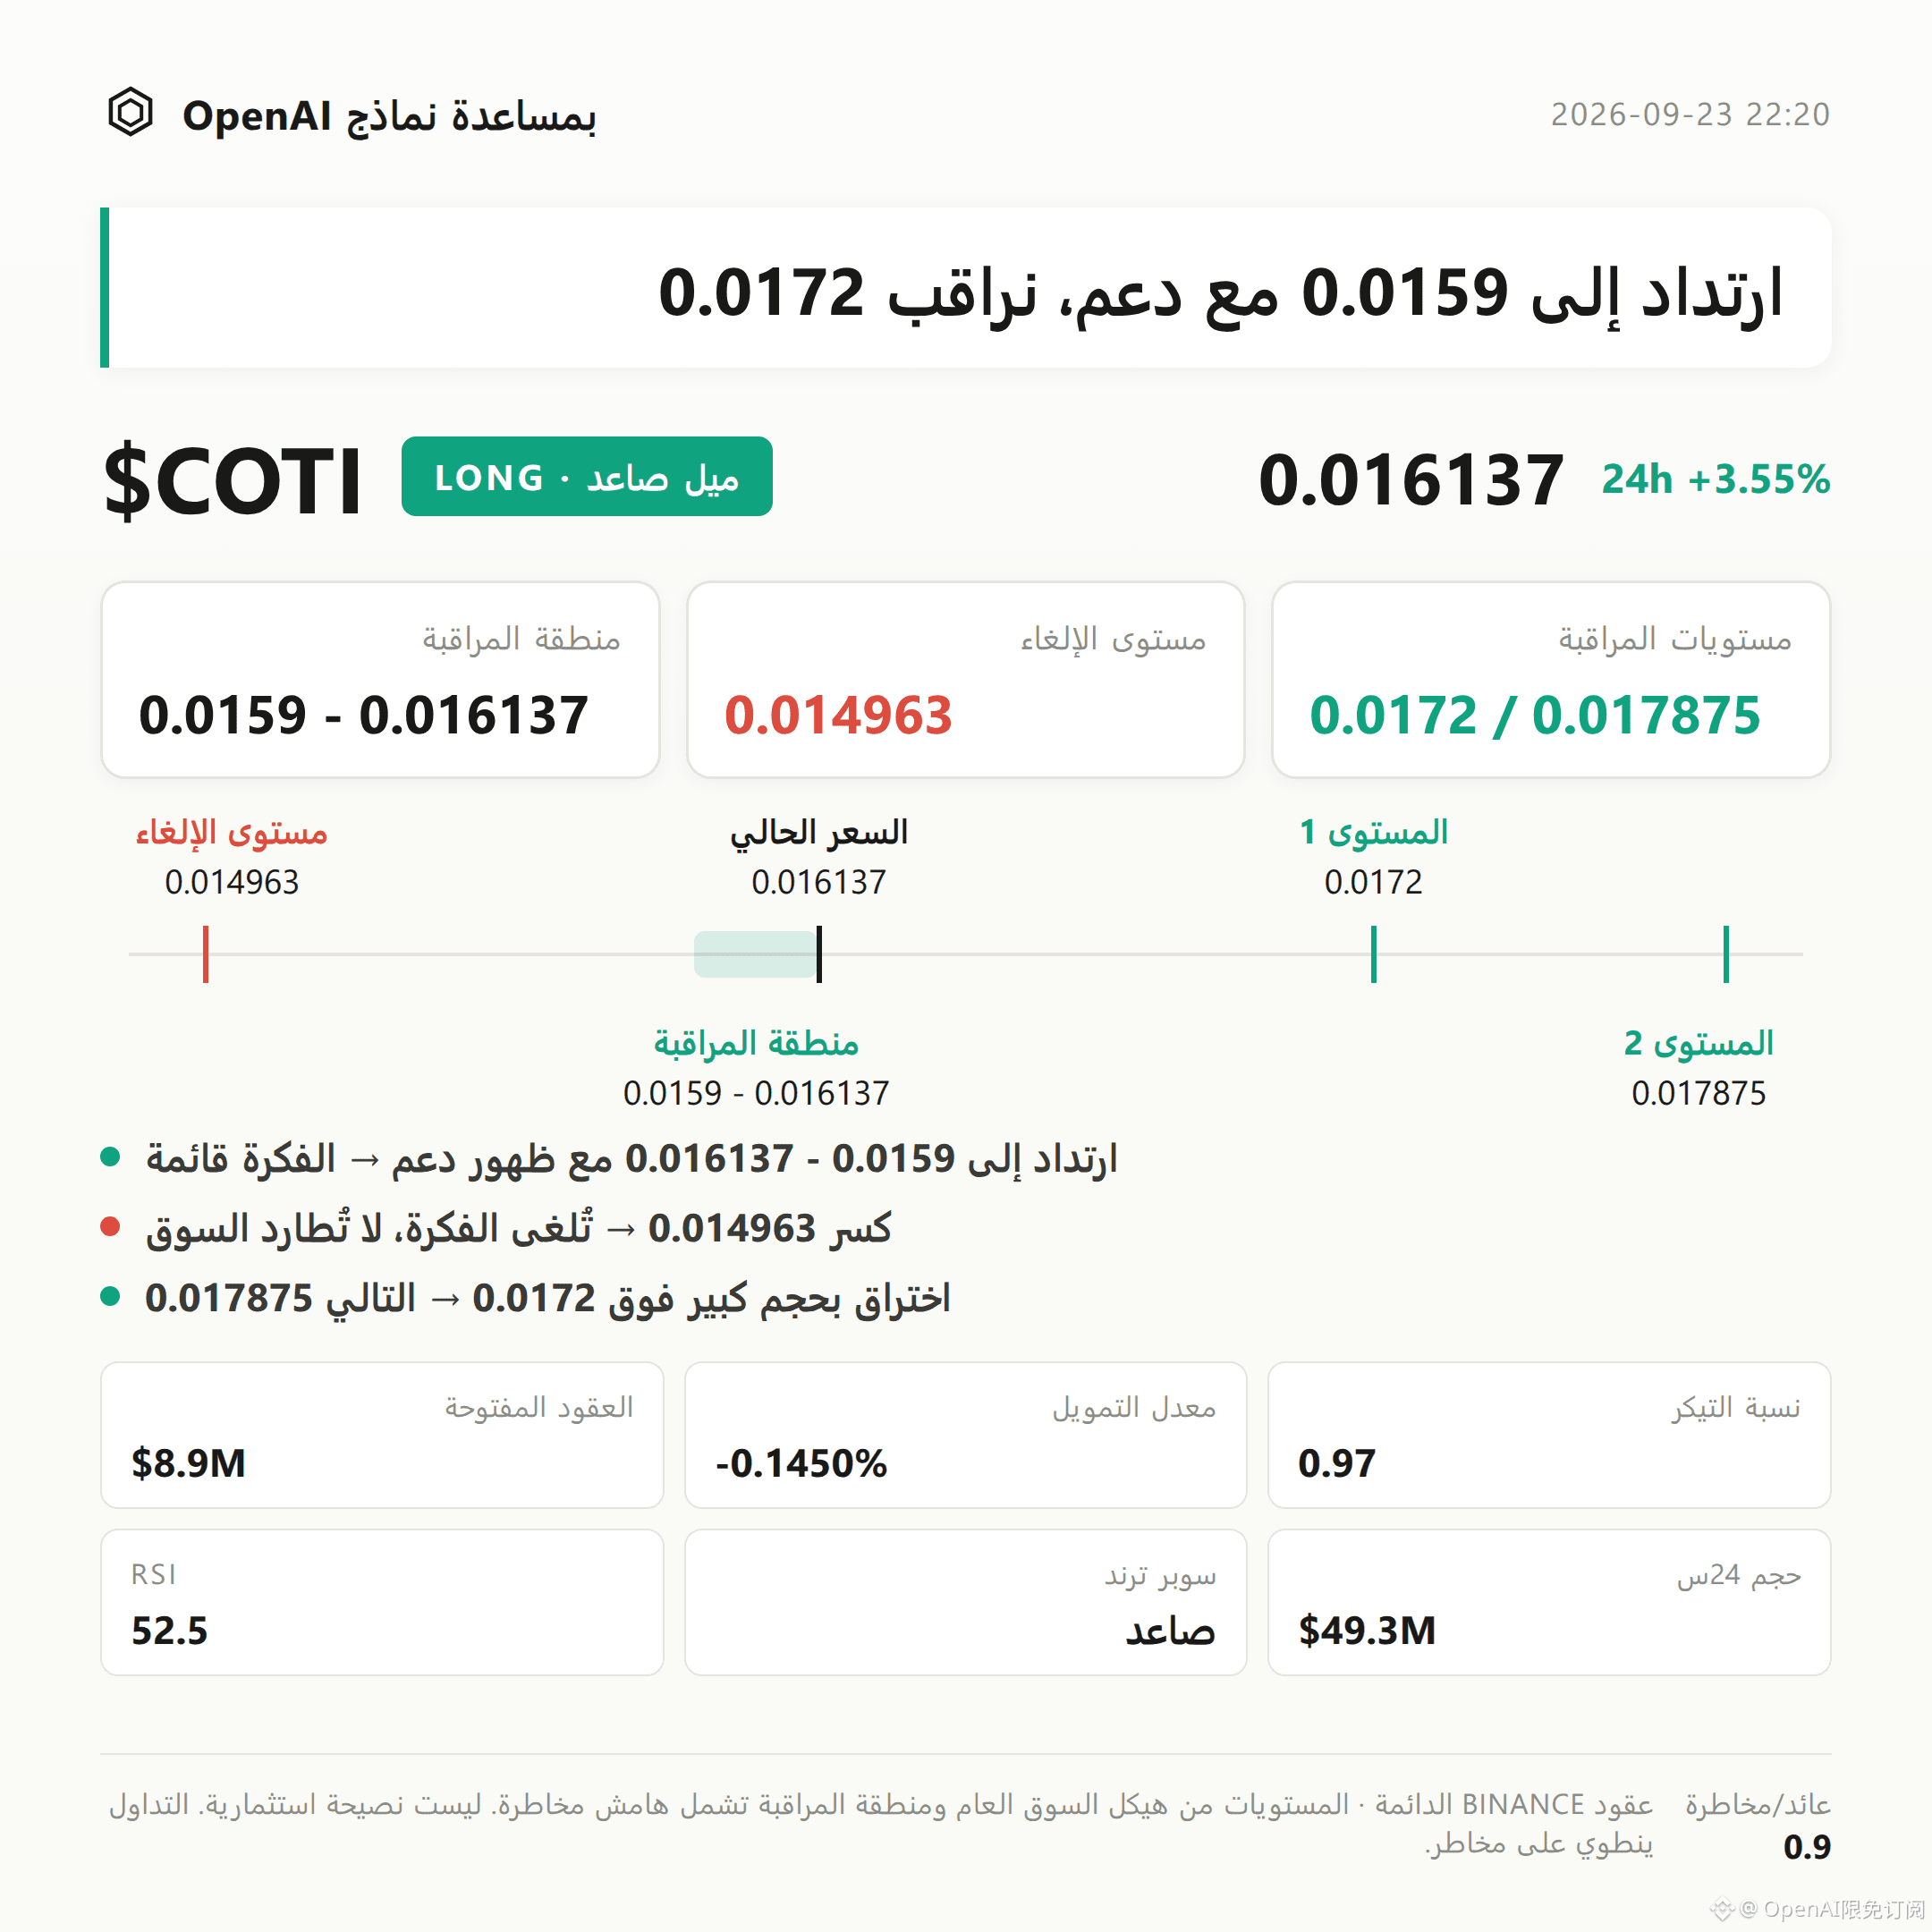
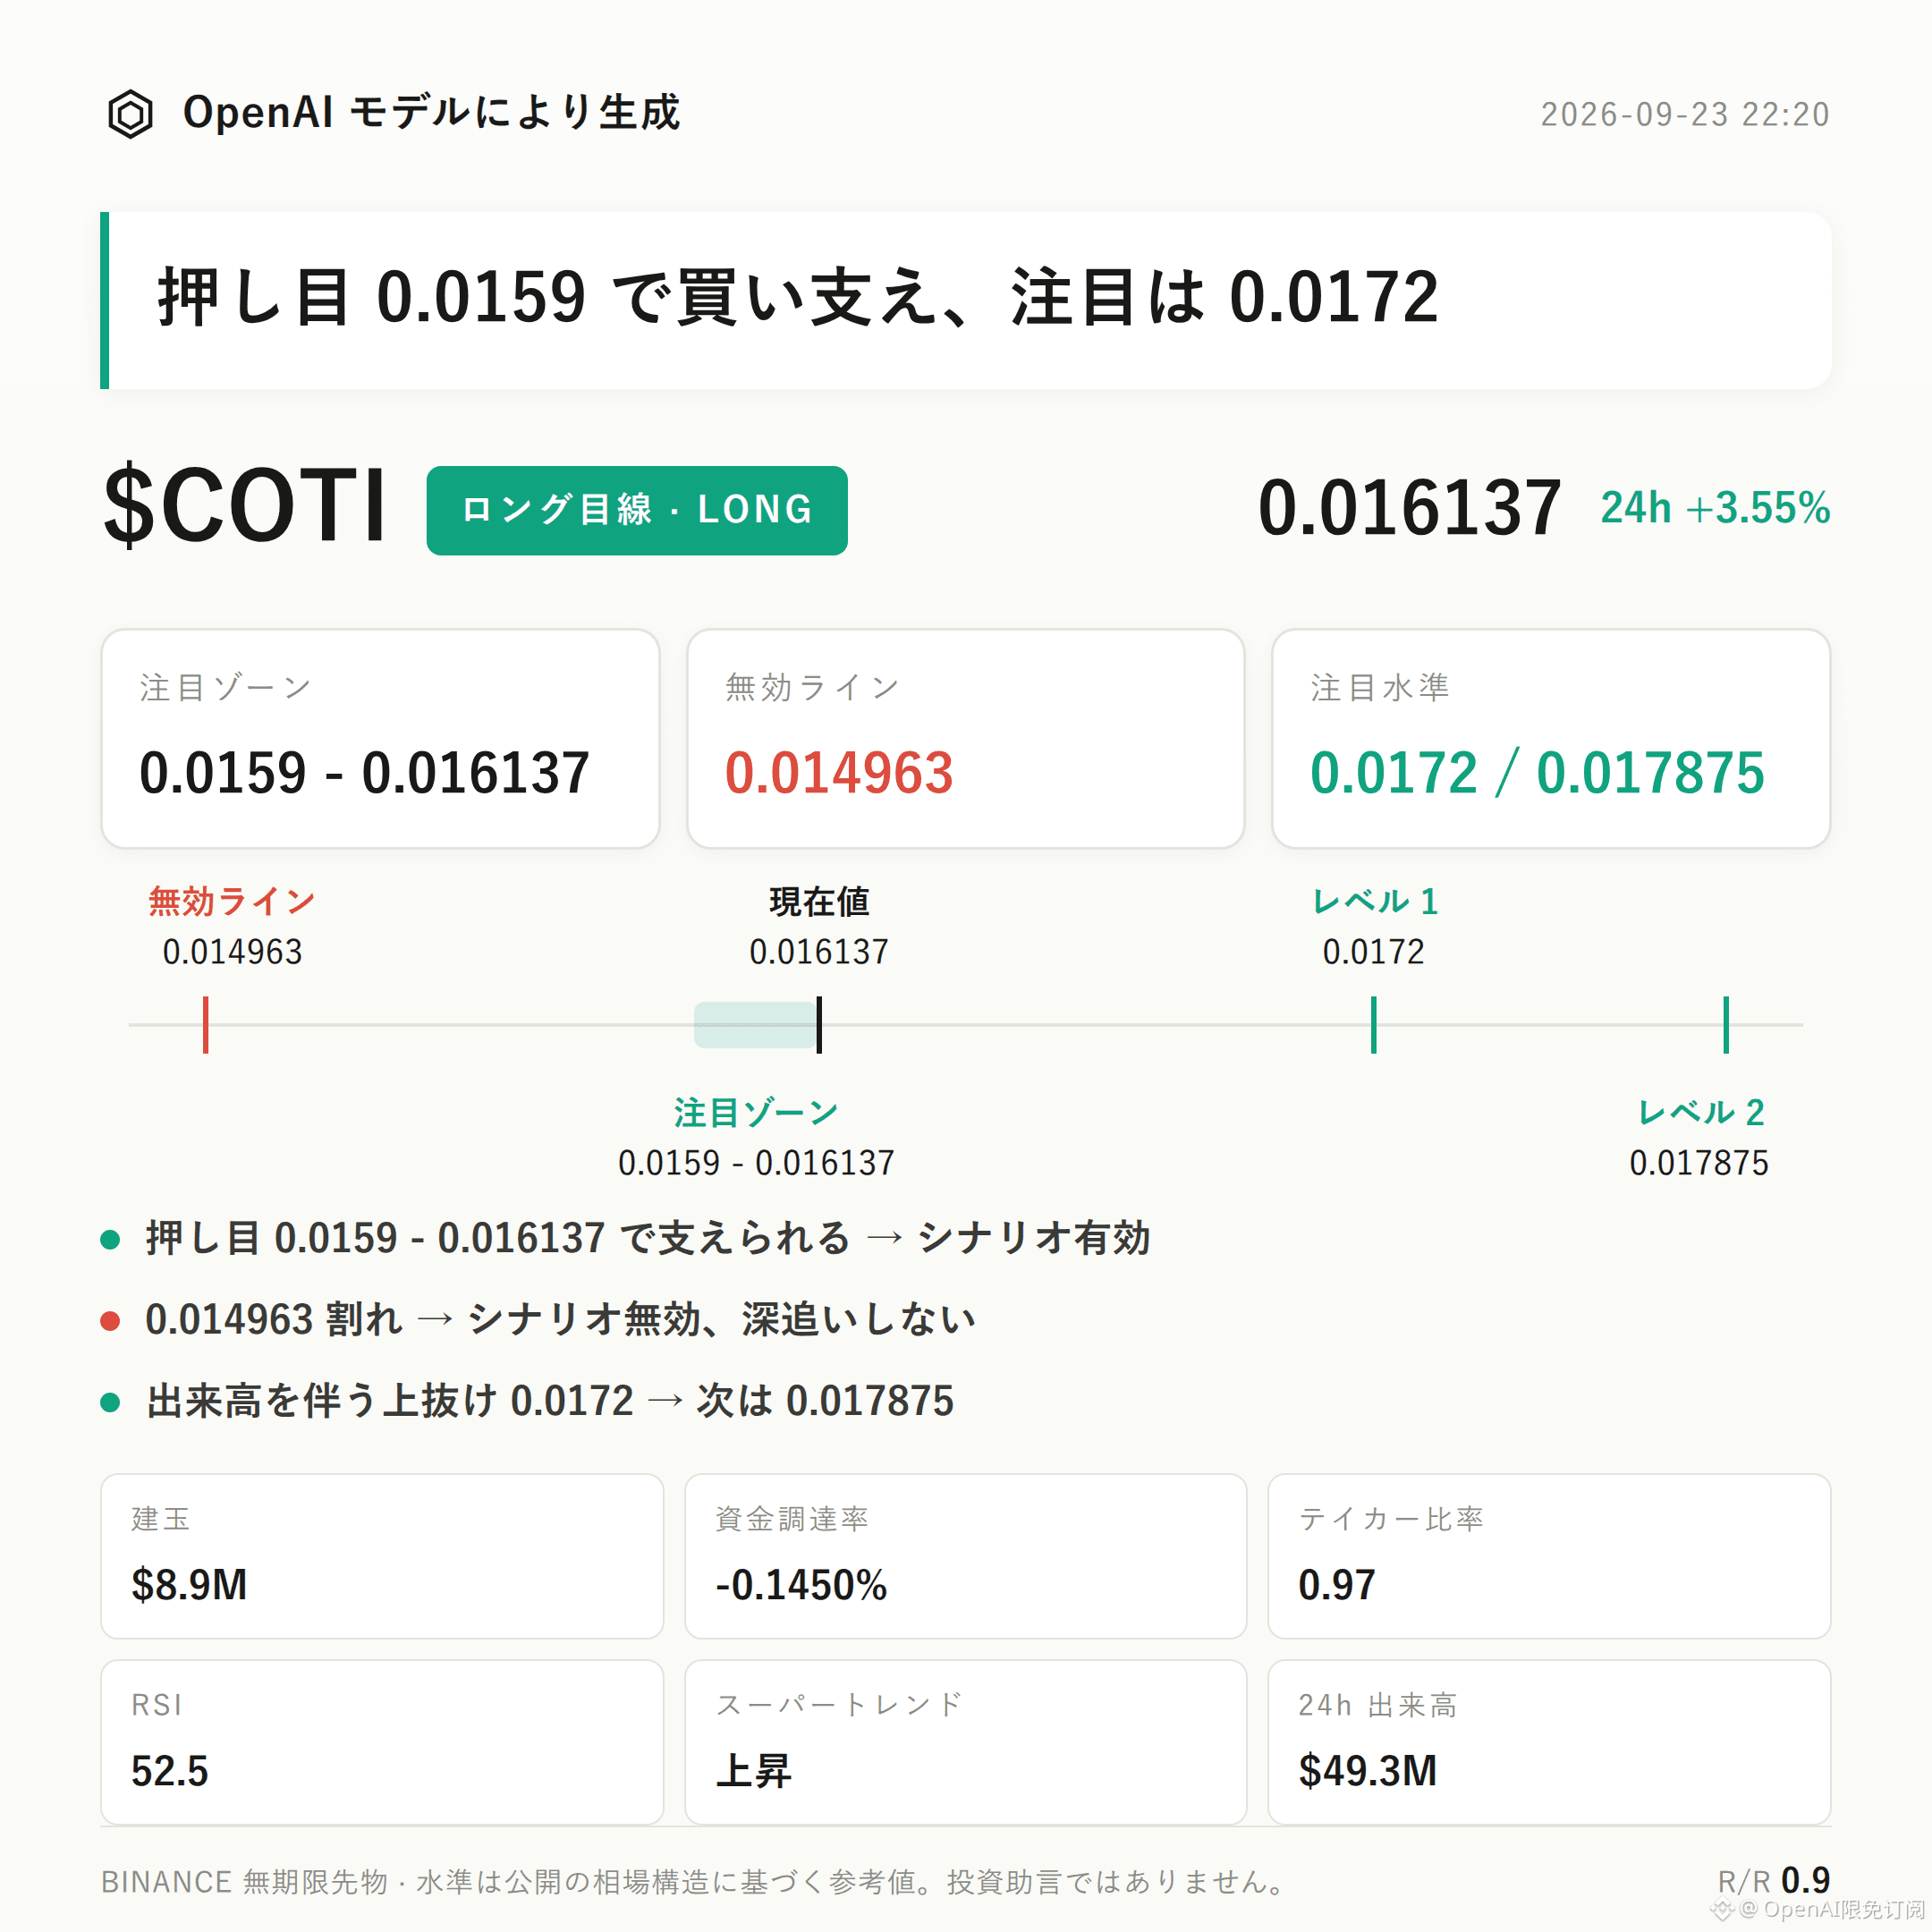
$COTI Bullish-leaning Plan | Watch Zone 0.0159 - 0.016137 | Invalidation Reference 0.014963 | Observation Levels 0.0172 / 0.017875
$COTI ’s current bullish-leaning structure is unfolding.
The key arguments come from three overlapping pieces of evidence: an uptrending Supertrend, MACD maintaining bullish momentum, and open interest increasing by 5.6% over 24 hours, amplifying the move in line with the trend.
The validation focus is whether the bullish side can continue to absorb price action around the watch zone.
In terms of technical structure: the recent high is 0.017875, the recent low is 0.014963, and the current price 0.016137 is in the upper-middle of the range.
On the Bollinger Bands: upper band 0.0172, middle band 0.0159, lower band 0.0147—price is running above the middle band.
RSI is 52.5, sitting in a healthy zone and not yet in overbought territory.
Supertrend is pointing upward, MACD maintains bullish momentum, and the 24h price increase of +3.55% reflects trend-following performance.
For derivatives data: 24h trading volume is $49.29 million, open interest is $8.87 million, and the 24h change is +5.6%, indicating that funds are increasing positions in sync with price.
The funding rate is -0.1450%. The long/short ratio shows longs account for 42%, and the active buy/sell ratio is 0.97.
Key level path (as reference): if price pulls back to 0.0159 - 0.016137 (the watch zone) and shows absorption, with price stabilizing without breaking down, then the bullish-leaning thesis holds and you can continue observing along the structure.
If price breaks below 0.014963, it means the current push-up structure is broken; the bullish-leaning thesis should be regarded as invalid and should not be applied further.
If price breaks upward above 0.0172 on increased volume and continues, you can then pay attention to resistance around 0.017875.
The risk on the other side must be disclosed accurately: the active buy/sell ratio is 0.97—buyers are not clearly in control, meaning the current strength to chase longs is limited, which is the main uncertainty in this bullish-leaning setup.
Reference risk/reward is 0.9. Based on the current reference level, potential upside is not meaningfully higher than potential risk—keep a cautious stance when evaluating.
With contract leverage, position discipline is more important than direction judgment.
For reference only and not investment advice. Contracts involve leverage—trading carries risk.
This article was generated with assistance from an OpenAI large model.
$COTI #Contract Analysis
$COTI Bullish-leaning Plan | Watch Zone 0.0159 - 0.016137 | Invalidation Reference 0.014963 | Observation Levels 0.0172 / 0.017875
$COTI ’s current bullish-leaning structure is unfolding.
The key arguments come from three overlapping pieces of evidence: an uptrending Supertrend, MACD maintaining bullish momentum, and open interest increasing by 5.6% over 24 hours, amplifying the move in line with the trend.
The validation focus is whether the bullish side can continue to absorb price action around the watch zone.
In terms of technical structure: the recent high is 0.017875, the recent low is 0.014963, and the current price 0.016137 is in the upper-middle of the range.
On the Bollinger Bands: upper band 0.0172, middle band 0.0159, lower band 0.0147—price is running above the middle band.
RSI is 52.5, sitting in a healthy zone and not yet in overbought territory.
Supertrend is pointing upward, MACD maintains bullish momentum, and the 24h price increase of +3.55% reflects trend-following performance.
For derivatives data: 24h trading volume is $49.29 million, open interest is $8.87 million, and the 24h change is +5.6%, indicating that funds are increasing positions in sync with price.
The funding rate is -0.1450%. The long/short ratio shows longs account for 42%, and the active buy/sell ratio is 0.97.
Key level path (as reference): if price pulls back to 0.0159 - 0.016137 (the watch zone) and shows absorption, with price stabilizing without breaking down, then the bullish-leaning thesis holds and you can continue observing along the structure.
If price breaks below 0.014963, it means the current push-up structure is broken; the bullish-leaning thesis should be regarded as invalid and should not be applied further.
If price breaks upward above 0.0172 on increased volume and continues, you can then pay attention to resistance around 0.017875.
The risk on the other side must be disclosed accurately: the active buy/sell ratio is 0.97—buyers are not clearly in control, meaning the current strength to chase longs is limited, which is the main uncertainty in this bullish-leaning setup.
Reference risk/reward is 0.9. Based on the current reference level, potential upside is not meaningfully higher than potential risk—keep a cautious stance when evaluating.
With contract leverage, position discipline is more important than direction judgment.
For reference only and not investment advice. Contracts involve leverage—trading carries risk.
This article was generated with assistance from an OpenAI large model.
$COTI #Contract Analysis