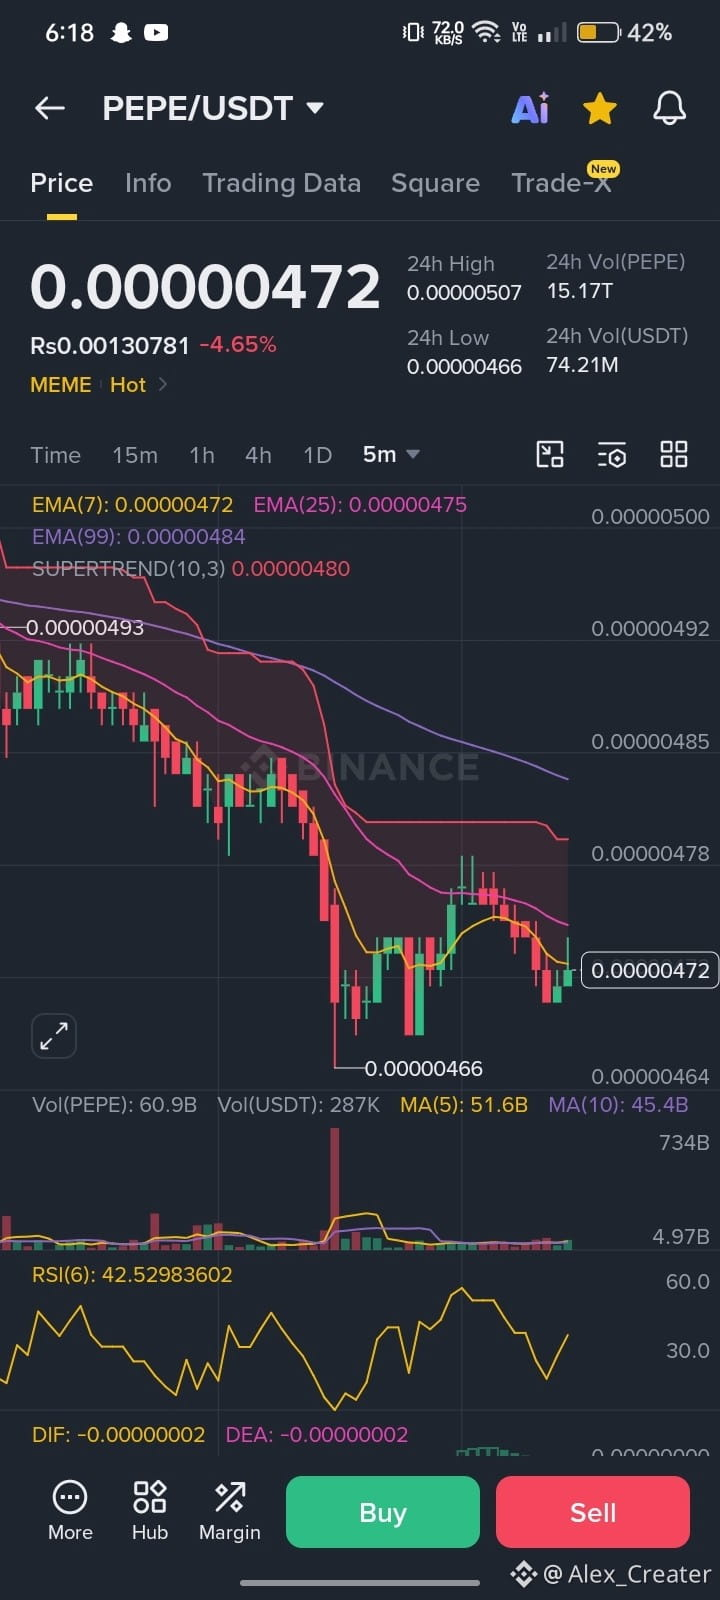
$PEPE PE/USDT – 5M Chart Analysis
PEPE is trading around 0.00000472, showing short-term weakness after rejection near 0.00000478.
🔹 Resistance: 0.00000478–0.00000484
🔹 Support: 0.00000466
🔹 RSI: ~42 — bearish momentum, but recovering
🔹 Trend: Short-term bearish/sideways
📈 Bullish scenario: A breakout above 0.00000478 could open the way toward 0.00000484.
📉 Bearish scenario: A breakdown below 0.00000466 may bring further selling pressure.
⚠️ Wait for confirmation before entering a trade.
#PEPE #PEPEUSDT #Crypto #Binance #TradingSignals #viralmypost #BTC #pepe
$PEPE $BTC
PEPE is trading around 0.00000472, showing short-term weakness after rejection near 0.00000478.
🔹 Resistance: 0.00000478–0.00000484
🔹 Support: 0.00000466
🔹 RSI: ~42 — bearish momentum, but recovering
🔹 Trend: Short-term bearish/sideways
📈 Bullish scenario: A breakout above 0.00000478 could open the way toward 0.00000484.
📉 Bearish scenario: A breakdown below 0.00000466 may bring further selling pressure.
⚠️ Wait for confirmation before entering a trade.
#PEPE #PEPEUSDT #Crypto #Binance #TradingSignals #viralmypost #BTC #pepe
$PEPE $BTC