📊 #BTC Breaks through a critical liquidity level
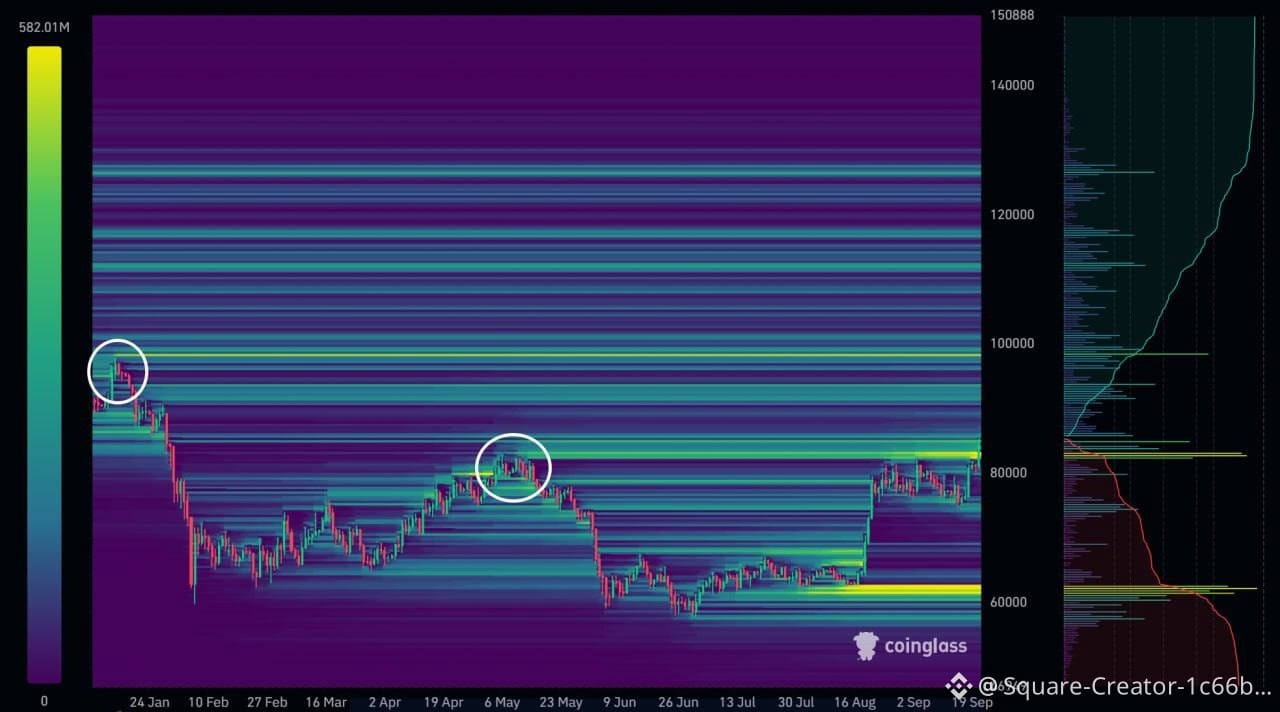
On the elimination chart, several liquidity levels appear close to the current price, and they correspond to the peak and trough zones on the weekly timeframe:
✅ The liquidity that was above the market’s peak in May has been liquidated.
🎯 The liquidity above the January peak still represents a longer-term target within a bullish market scenario.
❗ The liquidity below the consolidation range in July represents a factor that could support the occurrence of a correction—an important area to watch.
Therefore, the recent upward move can be viewed as a logical wave driven by the liquidation of sell positions and profit-taking. So far, the price has not formed a clear mid-term consolidation pattern; therefore, the market is still seeking its next structure 🕯️
However, the strength of the current upward momentum seems closer to the behavior of bull markets rather than bear markets. Technical indicators and liquidity are signaling that the downward pressure may be in its final stages, but the continuation of the trend will depend on the stability of momentum and the movement of liquidity in the coming period.
$BTC
#بيتكوين #BTC #crypto #العملات_الرقمية #crypto_market #تحليل_فني #bitcoin_analysis #liquidity #position_liquidation #Liquidation #CryptoMarket #BullMarket #BearMarket #Binance
On the elimination chart, several liquidity levels appear close to the current price, and they correspond to the peak and trough zones on the weekly timeframe:
✅ The liquidity that was above the market’s peak in May has been liquidated.
🎯 The liquidity above the January peak still represents a longer-term target within a bullish market scenario.
❗ The liquidity below the consolidation range in July represents a factor that could support the occurrence of a correction—an important area to watch.
Therefore, the recent upward move can be viewed as a logical wave driven by the liquidation of sell positions and profit-taking. So far, the price has not formed a clear mid-term consolidation pattern; therefore, the market is still seeking its next structure 🕯️
However, the strength of the current upward momentum seems closer to the behavior of bull markets rather than bear markets. Technical indicators and liquidity are signaling that the downward pressure may be in its final stages, but the continuation of the trend will depend on the stability of momentum and the movement of liquidity in the coming period.
$BTC
#بيتكوين #BTC #crypto #العملات_الرقمية #crypto_market #تحليل_فني #bitcoin_analysis #liquidity #position_liquidation #Liquidation #CryptoMarket #BullMarket #BearMarket #Binance