
Leverage-boosted trading on the Bitcoin side has cooled off.
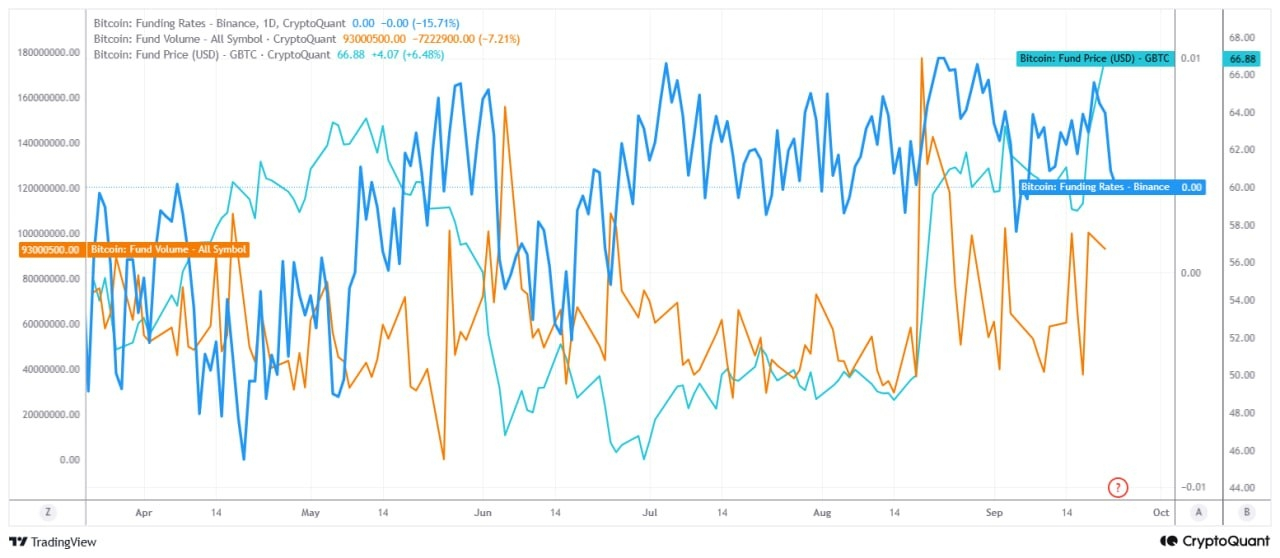
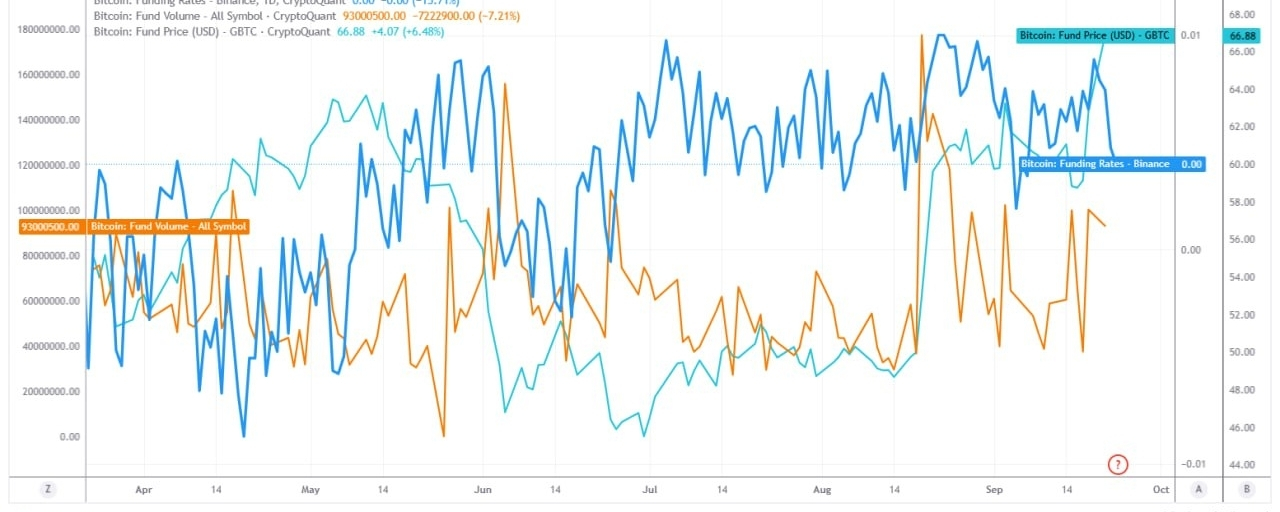
In this chart, I think the most important point is that the Funding Rate has returned to the 0.00 level. This indicates that leveraged positions in Bitcoin’s derivatives market have been significantly balanced. In positive funding, longs pay shorts; when funding approaches zero, it shows the market has become more balanced.
In the latest market data, the Binance BTC funding rate is around 0.001 as of September 23, 2026. If the rally is not being driven by excessively positive funding, then it can be assumed that there are no overly leveraged long positions behind the move. Therefore, the current picture is different from the idea that in the past, the price rose, everyone opened longs, funding surged, and liquidations of long positions followed. We can see that long positions have not been accumulating aggressively. If the price continues to rise in such an environment, the market may move forward in a healthier way. However, it is necessary to read the other two metrics on the chart together as well.
Fund Volume has risen to around 93 million recently. In particular, there has been a clear rebound in volume after the low levels around mid-August. This tells us the market is once again seeing more trading and fund activity.
The fact that Funding is also low at the same time as the volume increase suggests that this activity isn’t being supported with overly high leverage.
GBTC Fun Price has risen to around 66.88 in the latest segment. Therefore,
The rise in the GBTC price together with the recovery in fund volume can be considered an additional signal that activity from the institutional side is increasing.
Just by looking at this chart, I don’t see a signal that a strong repeat decline is about to begin. In fact, the main advantage of the current funding structure is that Funding isn’t overly positive—there hasn’t been a crowded long build-up, and the risk of long liquidations is limited. A large portion of the sharp sell-offs we’ve seen previously in the markets were accelerated by high funding and a break down in price.
We can summarize the current view of the chart as follows. In the Bitcoin derivatives market, excessively long positioning is not clearly visible right now. The Funding Rate approaching 0.00 indicates that leverage pressure has been cleaned up and the market has become more balanced. At the same time, the recovery in Fund Volume shows that market activity is increasing again. Therefore, looking only at this chart, there isn’t enough data to say that a new, sharp drop has started. In short, what stands out to me as alarming on the chart right now is that the leverage side has calmed down quite a lot. This structure may indicate that if price rises again, the move has not yet relied on an excessively crowded long position.