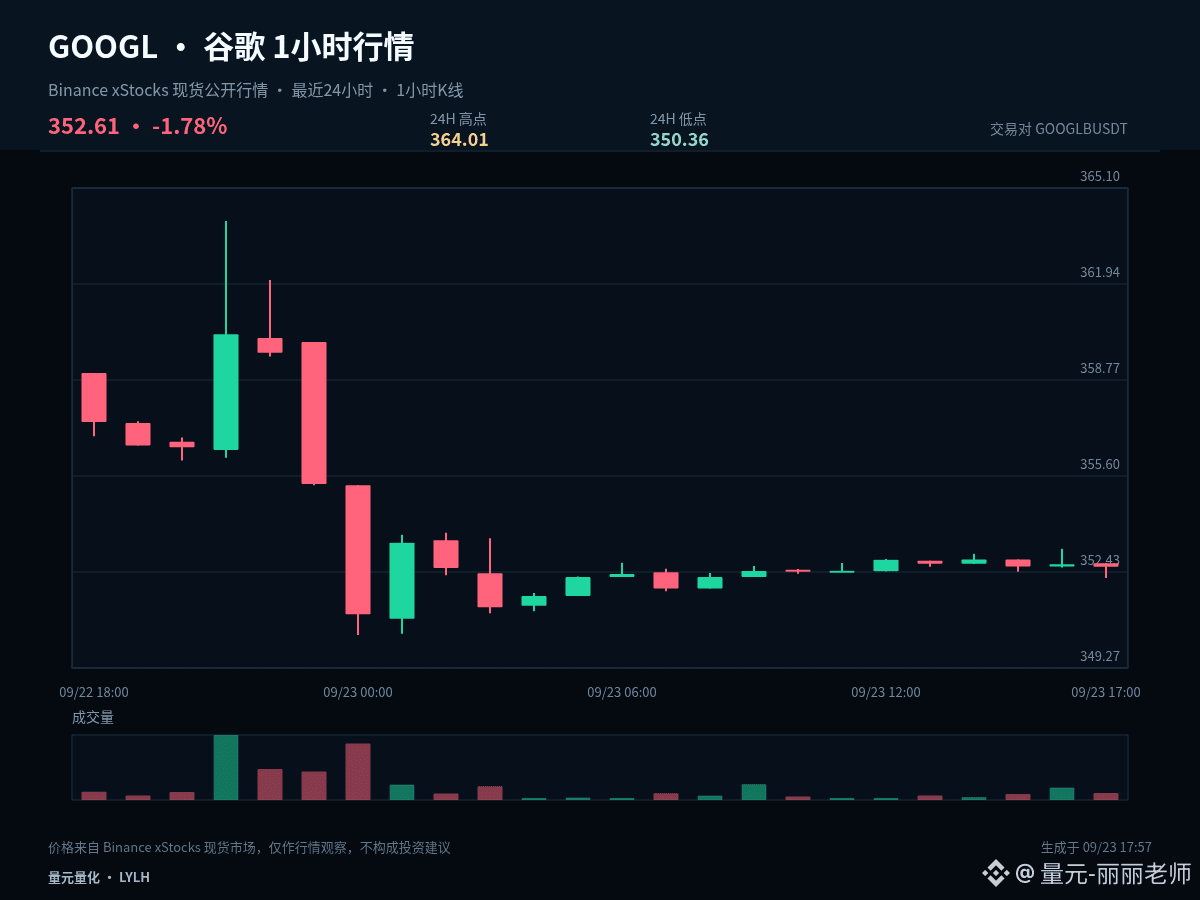
$GOOGLB #GOOGL If I could keep only one observation price in this round, I’d choose 357.185. Current price: 352.61, 1 hour -0.02%, 24 hours -1.75%. Keeping track of gains and losses relative to the midline can help filter out a lot of intraday noise.
The price has not yet recovered 357.185. For now, treat the current rebound as a weak repair; true strength depends on a stable close proving it. If it turns weak again, 350.36 is the next level to observe whether the sell pressure is fading.
Current price is near the lower bound of the past 24-hour range: 1 hour -0.02%, 24 hours -1.75%. The core of low-level analysis isn’t about catching the bottom early—it’s about whether, after a breakdown, the price can quickly reclaim. If it can reclaim, it suggests sell pressure is being absorbed. If it stays below the lower bound continuously, it means weakness hasn’t ended.
My scenario analysis isn’t a single bet on one direction. A break above 364.01 and holding it means the upside space is reopened. A fall below 350.36 and failing to reclaim it on the retest means the structure turns weaker further. If price moves between the two, continue observing the closing behavior on both sides of 357.185.
Position management should separate the medium-term from the short-term. For existing medium-term positions, first assess whether the structure is broken; don’t be repeatedly swayed by a single 1-hour candlestick. Short-term positions should be executed around support, resistance, and confirmation by closing. If you’re currently in cash (no position), you don’t need to chase the price in the middle of the range—waiting for a clearer level is often more advantageous.
The real divergence in this market is whether it will continue trending or revert to the range. Will you wait for a breakout confirmation, or wait for a support pullback? Tell me the price level you’re most focused on.
#21SharesLaunchesEuropesFirstZcashETP
The price has not yet recovered 357.185. For now, treat the current rebound as a weak repair; true strength depends on a stable close proving it. If it turns weak again, 350.36 is the next level to observe whether the sell pressure is fading.
Current price is near the lower bound of the past 24-hour range: 1 hour -0.02%, 24 hours -1.75%. The core of low-level analysis isn’t about catching the bottom early—it’s about whether, after a breakdown, the price can quickly reclaim. If it can reclaim, it suggests sell pressure is being absorbed. If it stays below the lower bound continuously, it means weakness hasn’t ended.
My scenario analysis isn’t a single bet on one direction. A break above 364.01 and holding it means the upside space is reopened. A fall below 350.36 and failing to reclaim it on the retest means the structure turns weaker further. If price moves between the two, continue observing the closing behavior on both sides of 357.185.
Position management should separate the medium-term from the short-term. For existing medium-term positions, first assess whether the structure is broken; don’t be repeatedly swayed by a single 1-hour candlestick. Short-term positions should be executed around support, resistance, and confirmation by closing. If you’re currently in cash (no position), you don’t need to chase the price in the middle of the range—waiting for a clearer level is often more advantageous.
The real divergence in this market is whether it will continue trending or revert to the range. Will you wait for a breakout confirmation, or wait for a support pullback? Tell me the price level you’re most focused on.
#21SharesLaunchesEuropesFirstZcashETP