$TAKE
🔥 Technical Analysis
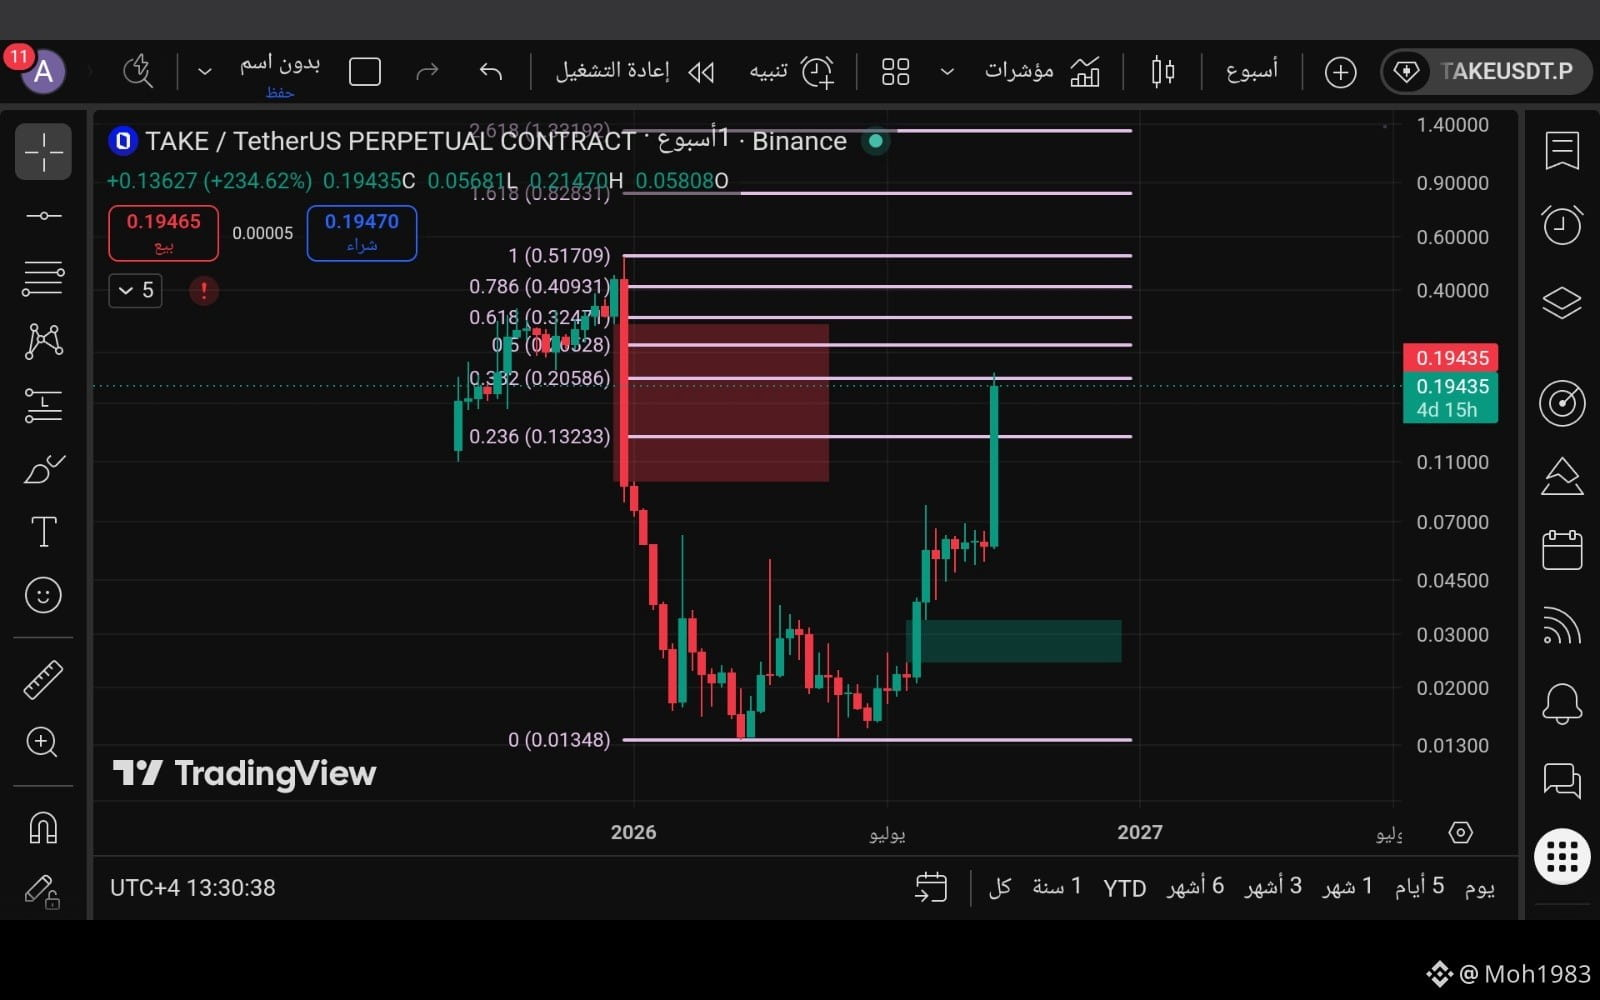
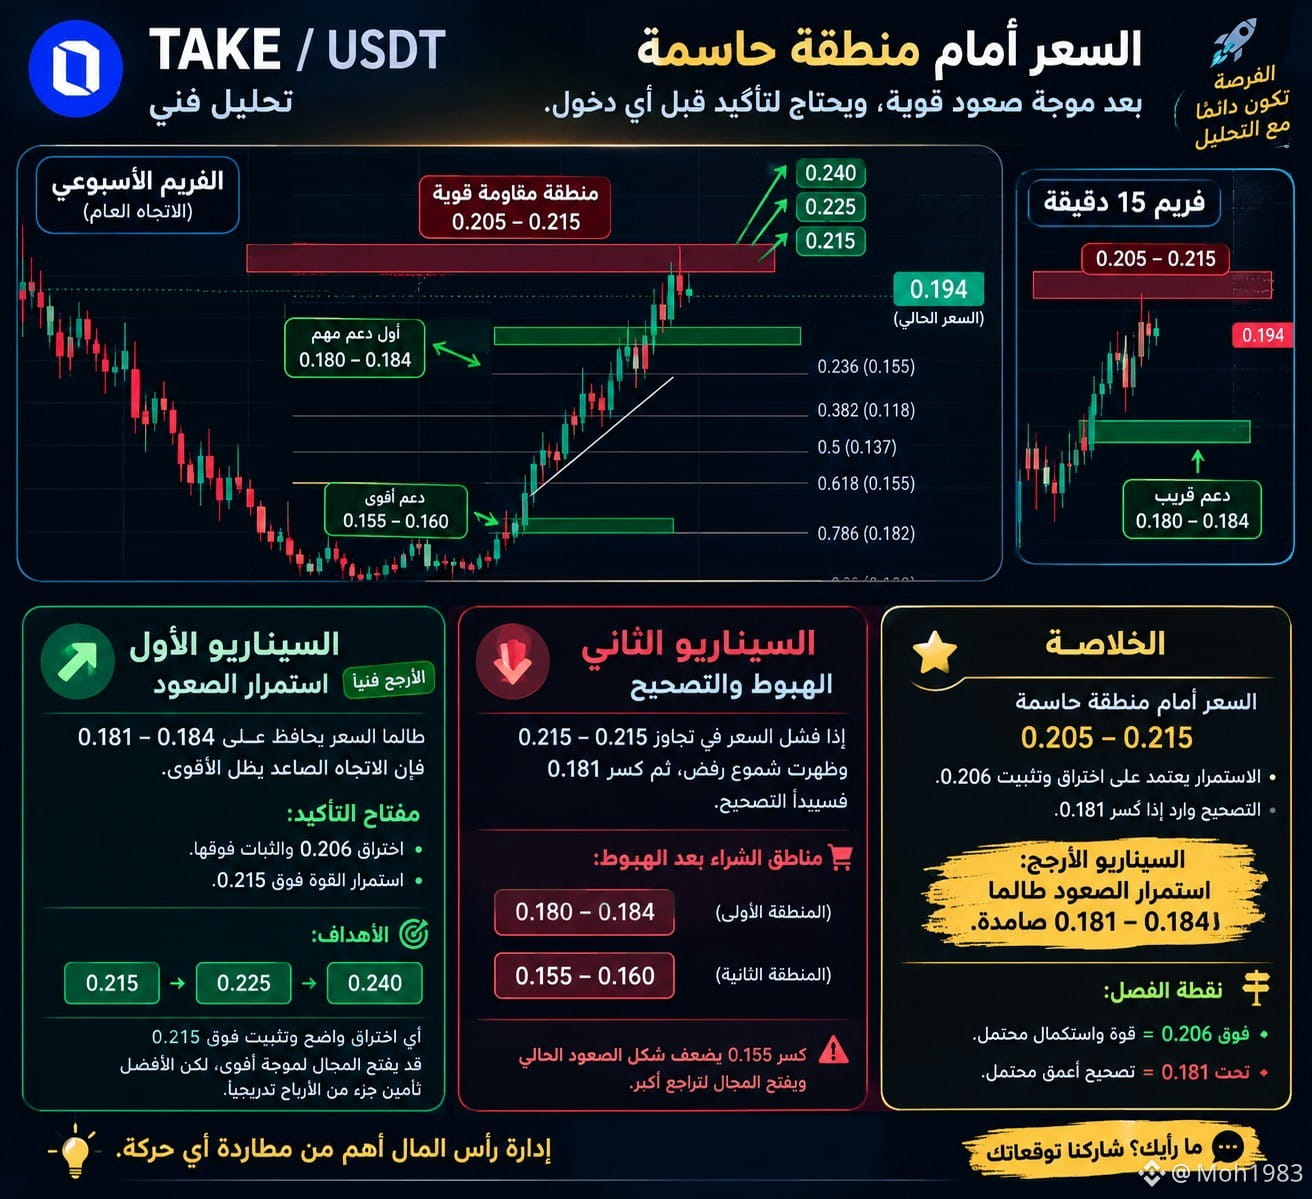
The price is currently around 0.194 after a very strong upward wave. On the weekly timeframe, the trend is still bullish, but the price has become close to an important resistance zone at 0.205–0.215. Therefore, the current area needs confirmation, and it’s not advisable to chase the price.
🟢 First Scenario | Continuation of the Uptrend — Most Likely Technically Currently
As long as the price holds 0.181–0.184, the uptrend remains the strongest scenario on the chart.
A break above 0.206 and holding above it supports the wave’s continuation toward:
🎯 0.215
🎯 0.225
🎯 0.240
Holding above 0.215 would be an additional sign of continued strength.
🔴 Second Scenario | Drop and Correction
If the price fails to break above 0.205–0.215 and starts breaking down below 0.181, then I expect the price to enter a deeper correction.
📍 Areas to Watch for Buying After the Drop: 0.180–0.184
Then 0.155–0.160
But breaking below 0.155 weakens the current upward structure and opens the door for a bigger pullback.
📌 Most Likely Scenario:
Based on the current price action structure, the continuation of the uptrend remains the most likely as long as 0.181–0.184 stays intact. However, the price is now facing strong resistance. So it’s better to wait for a breakout and consolidation, or wait for a pullback to the support zone instead of entering randomly at 0.194.
Decision Point:
Above 0.206 = strength and potential continuation.
Below 0.181 = potentially deeper correction.
🔥 Technical Analysis
The price is currently around 0.194 after a very strong upward wave. On the weekly timeframe, the trend is still bullish, but the price has become close to an important resistance zone at 0.205–0.215. Therefore, the current area needs confirmation, and it’s not advisable to chase the price.
🟢 First Scenario | Continuation of the Uptrend — Most Likely Technically Currently
As long as the price holds 0.181–0.184, the uptrend remains the strongest scenario on the chart.
A break above 0.206 and holding above it supports the wave’s continuation toward:
🎯 0.215
🎯 0.225
🎯 0.240
Holding above 0.215 would be an additional sign of continued strength.
🔴 Second Scenario | Drop and Correction
If the price fails to break above 0.205–0.215 and starts breaking down below 0.181, then I expect the price to enter a deeper correction.
📍 Areas to Watch for Buying After the Drop: 0.180–0.184
Then 0.155–0.160
But breaking below 0.155 weakens the current upward structure and opens the door for a bigger pullback.
📌 Most Likely Scenario:
Based on the current price action structure, the continuation of the uptrend remains the most likely as long as 0.181–0.184 stays intact. However, the price is now facing strong resistance. So it’s better to wait for a breakout and consolidation, or wait for a pullback to the support zone instead of entering randomly at 0.194.
Decision Point:
Above 0.206 = strength and potential continuation.
Below 0.181 = potentially deeper correction.