Greed Index at 71, funding rate turns positive—will this surge be short covering, or is real money actually moving in?
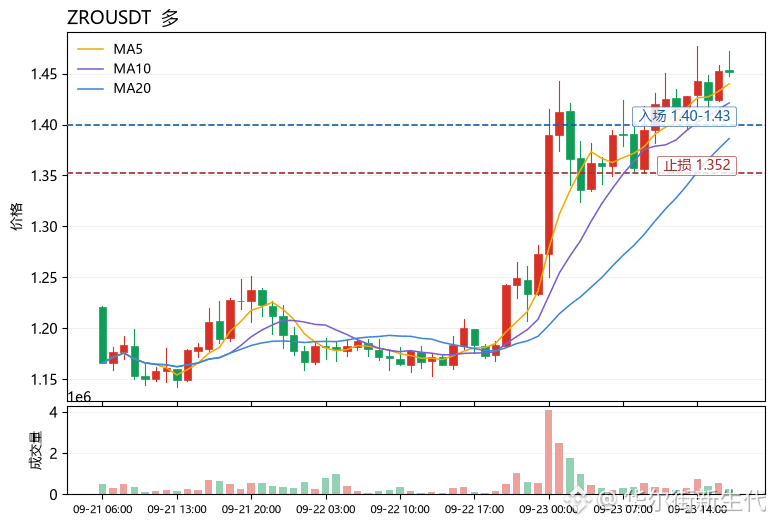
The answer leans toward the latter, but the short-term is already in a battle zone. $ZRO surged 22.86% within 24 hours; current price is 1.451. MA5 is at 1.44 crossing above MA20 at 1.3862, and the MACD histogram has turned positive—trend structure is indeed bullish. However, RSI is already at 68.8, nearing overbought. The upper Bollinger band is at 1.49624 right overhead, and the funding rate of +0.0050% indicates longs have started paying for positions, raising the cost of chasing longs. Over the last 30 candles, the amplitude is 22.31%, and the risk of wick/spike is significant. A high concentration of liquidation is likely below 1.40.
As for execution: don’t chase. Wait for a pullback. Entry reference: 1.40–1.43. This zone is close to MA5 and serves as a post-breakout retest confirmation area, supported by a stabilization signal above the Bollinger middle band. Take profit 1 at 1.496 (resistance at the upper Bollinger band). Take profit 2 at 1.55 (expansion level after breaking above the upper band). Set stop loss at 1.352. If it breaks below MA20, the long structure is damaged; meanwhile, RSI will quickly drop.
Also watch in the same period: $PUMP , where the shorts are aligned and RSI is only 40—relatively weak; $SEI , where moving averages are sticking together with unclear direction, and the MAs are weaker than ZRO.
(Personal opinion only for reference and does not constitute any investment advice. Contract risk is extremely high—strictly control position size.)
【Data】
Coin: ZROUSDT
Direction: Long
Entry: 1.40-1.43
Take profit 1: 1.496
Take profit 2: 1.55
Stop loss: 1.352
The answer leans toward the latter, but the short-term is already in a battle zone. $ZRO surged 22.86% within 24 hours; current price is 1.451. MA5 is at 1.44 crossing above MA20 at 1.3862, and the MACD histogram has turned positive—trend structure is indeed bullish. However, RSI is already at 68.8, nearing overbought. The upper Bollinger band is at 1.49624 right overhead, and the funding rate of +0.0050% indicates longs have started paying for positions, raising the cost of chasing longs. Over the last 30 candles, the amplitude is 22.31%, and the risk of wick/spike is significant. A high concentration of liquidation is likely below 1.40.
As for execution: don’t chase. Wait for a pullback. Entry reference: 1.40–1.43. This zone is close to MA5 and serves as a post-breakout retest confirmation area, supported by a stabilization signal above the Bollinger middle band. Take profit 1 at 1.496 (resistance at the upper Bollinger band). Take profit 2 at 1.55 (expansion level after breaking above the upper band). Set stop loss at 1.352. If it breaks below MA20, the long structure is damaged; meanwhile, RSI will quickly drop.
Also watch in the same period: $PUMP , where the shorts are aligned and RSI is only 40—relatively weak; $SEI , where moving averages are sticking together with unclear direction, and the MAs are weaker than ZRO.
(Personal opinion only for reference and does not constitute any investment advice. Contract risk is extremely high—strictly control position size.)
【Data】
Coin: ZROUSDT
Direction: Long
Entry: 1.40-1.43
Take profit 1: 1.496
Take profit 2: 1.55
Stop loss: 1.352