

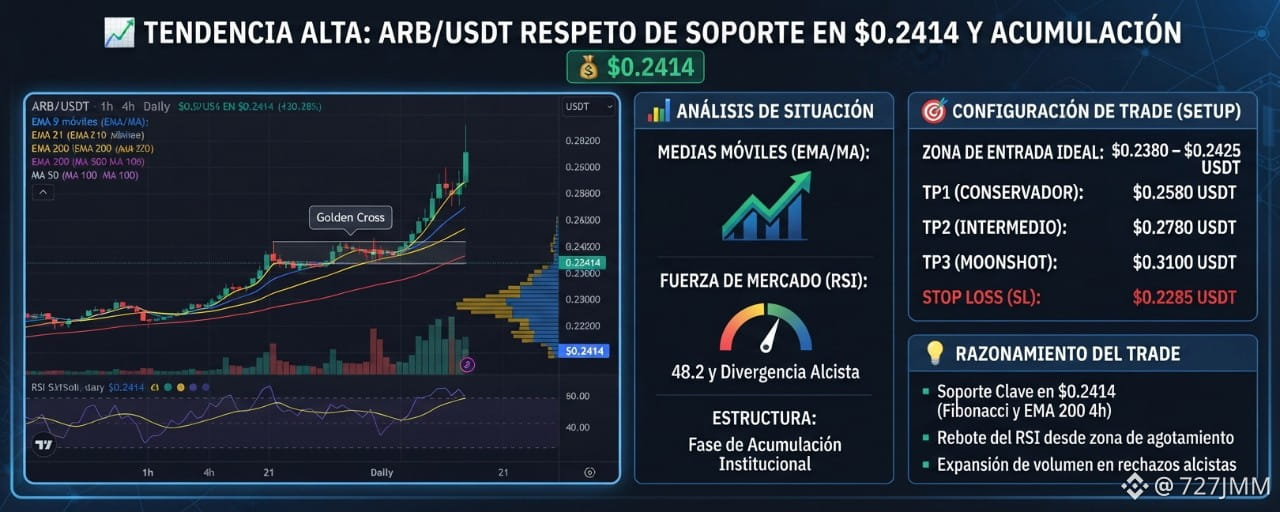


ARB/USDT in timeframes of 1h, 4h, and Daily to identify high-probability opportunities on Binance Square.
Situation Analysis
Moving Averages (EMAs and MAs): On the daily chart, price respects the macrostructure while the MAs (50 and 100) support the underlying bullish bias. On the 4h timeframe, the EMAs (9 and 21) show lateral compression after the pullback to the level of $0.2414. On the 1h timeframe, the beginning of a technical crossover (Golden Cross) is visible, with EMA 9 above EMA 21, indicating a short-term turn.
Market Strength and Volume: The RSI on the 4h timeframe stands at 48.2, bouncing off the oversold zone and forming a clear hidden bullish divergence. Volume drops significantly during bearish candles and expands on bullish rejections, confirming we are in an institutional accumulation phase before the breakout.
Trade Setup Configuration
Ideal entry zone: $0.2380 – $0.2425 USDT
TP1 (Conservative): $0.2580 USDT (Take partials and move SL to breakeven)
TP2 (Intermediate): $0.2780 USDT (Key resistance based on the Fibonacci retracement)
TP3 (Moonshot): $0.3100 USDT (Extended target amid volume expansion)
Stop Loss (SL): $0.2285 USDT (Strict technical invalidation level below structural support)
Trade Range (Rationale)
We enter a long position by taking advantage of a precise technical bounce off the psychological level of $0.2414, supported by the confluence of the 200 EMA on 4h and the support of the golden Fibonacci zone. The RSI crossing upward over the midline and the contraction of sell-side supply validate the high probability of this setup.