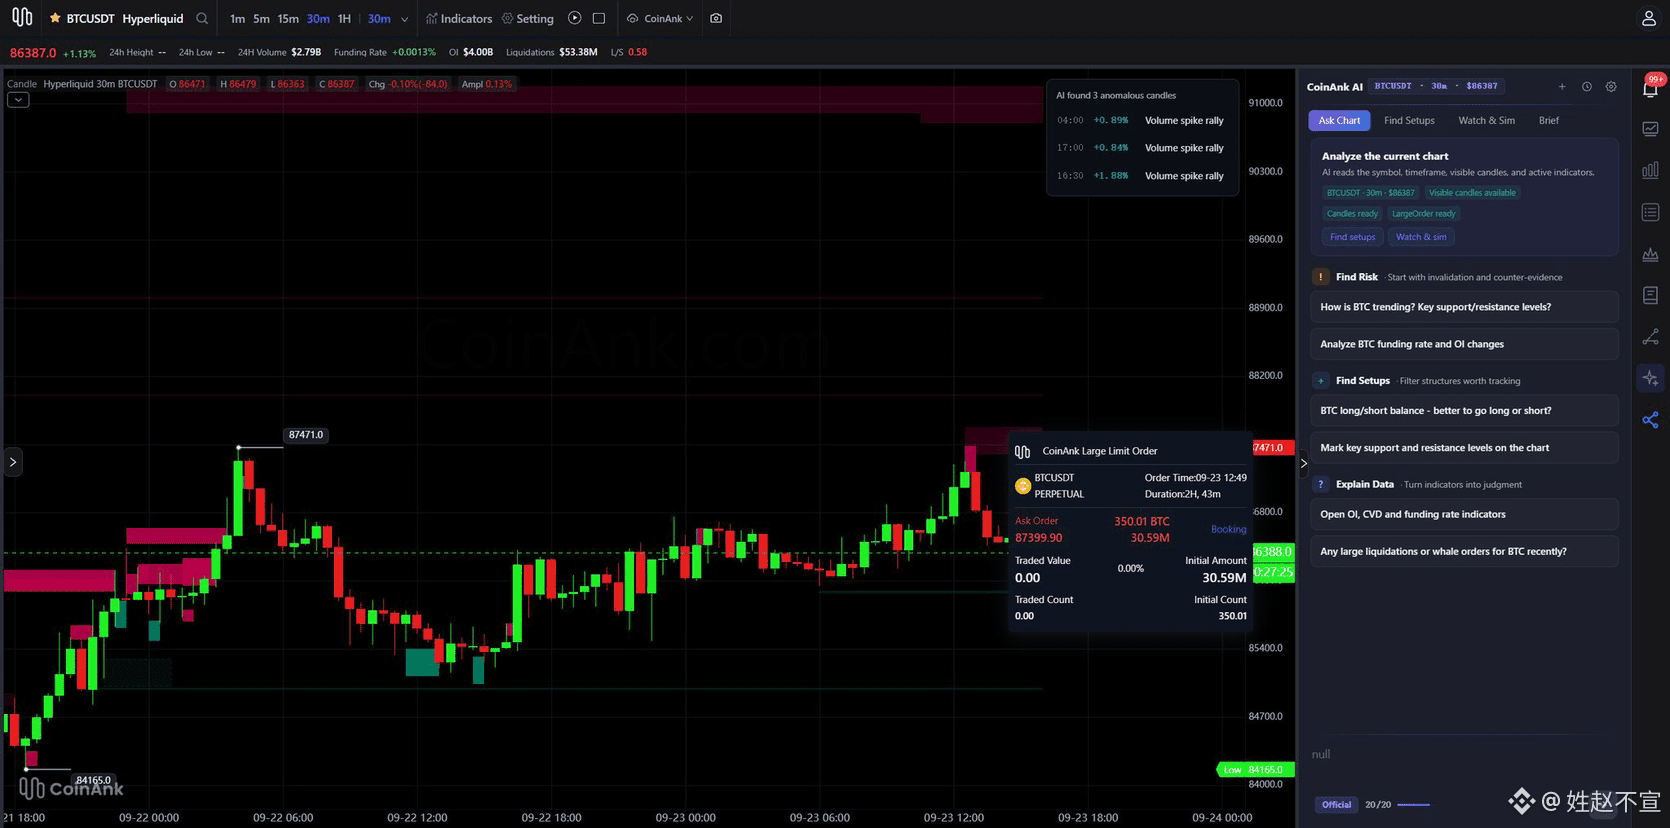

Brothers, I just saw CoinAnk blow up this Hyperliquid BTC perpetual “sell wall.” As a seasoned futures trader who watches the order book every day, I have to break it down in depth.
A $30.6 million limit sell order—exactly 350 BTC—was precisely placed at 87,399.9. It’s been hanging there for almost 3 hours, with成交量 (trading volume) at 0. The price pushed up to 87,471 “kissed” the wall, and was immediately slapped back to 86,387. This isn’t ordinary depth; this is a clear, straight-to-the-point resistance.
With a wall of this size, there are only three possibilities:
1) A real whale is unloading or hedging here, not wanting the price to get above 87.4k too easily;
2) Spoofing to lure momentum—placing it to scare people, then canceling it after retail chases higher;
3) A liquidity magnet—deliberately putting it here to attract big orders to get eaten.
The first test got blocked and sent back. That suggests the wall is temporarily effective. The real action is in the second and third times it’s touched. If the wall keeps getting chipped away but still stays solidly posted, then it’s genuine sell pressure: 87.4k is the ceiling for this stretch and could pull back to 85k or even lower at any time. If, suddenly, the whole wall gets canceled or gets eaten through in one bite, then that’s the end of the bear trap—short-term price could rocket straight to 88.5–89k.
Putting it together with the current chart: the funding rate is still positive, OI isn’t low, and we’ve just gone through a wave of short covering. On the short side, there are also plenty of large positions—around 87.4k is exactly the comfortable zone for them.
My trading logic is simple: don’t chase longs from this level. Wait and see how the wall reacts. Once the wall breaks, then you get on board. If the wall holds, be prepared to catch the falling “flying knife.” Futures aren’t spot—these big walls are often more honest than candlestick patterns.
Keep an eye on that CoinAnk chart—when that wall moves, the market moves. What do you think: real wall or fake wall?
A $30.6 million limit sell order—exactly 350 BTC—was precisely placed at 87,399.9. It’s been hanging there for almost 3 hours, with成交量 (trading volume) at 0. The price pushed up to 87,471 “kissed” the wall, and was immediately slapped back to 86,387. This isn’t ordinary depth; this is a clear, straight-to-the-point resistance.
With a wall of this size, there are only three possibilities:
1) A real whale is unloading or hedging here, not wanting the price to get above 87.4k too easily;
2) Spoofing to lure momentum—placing it to scare people, then canceling it after retail chases higher;
3) A liquidity magnet—deliberately putting it here to attract big orders to get eaten.
The first test got blocked and sent back. That suggests the wall is temporarily effective. The real action is in the second and third times it’s touched. If the wall keeps getting chipped away but still stays solidly posted, then it’s genuine sell pressure: 87.4k is the ceiling for this stretch and could pull back to 85k or even lower at any time. If, suddenly, the whole wall gets canceled or gets eaten through in one bite, then that’s the end of the bear trap—short-term price could rocket straight to 88.5–89k.
Putting it together with the current chart: the funding rate is still positive, OI isn’t low, and we’ve just gone through a wave of short covering. On the short side, there are also plenty of large positions—around 87.4k is exactly the comfortable zone for them.
My trading logic is simple: don’t chase longs from this level. Wait and see how the wall reacts. Once the wall breaks, then you get on board. If the wall holds, be prepared to catch the falling “flying knife.” Futures aren’t spot—these big walls are often more honest than candlestick patterns.
Keep an eye on that CoinAnk chart—when that wall moves, the market moves. What do you think: real wall or fake wall?