


Original IOSG Ventures IOSG Ventures September 21, 2026 20:01 Guangdong
This article is for learning and exchange only and does not constitute any investment advice. Please indicate the source when reprinting and contact the IOSG team to obtain authorization and to understand the reprint requirements. All projects mentioned in this article are not recommendations or investment advice.
Author|Ethan @IOSG
TL;DR
From 2026 to present, Binance spot listings have been delisted for 42 tokens, more than any full year since 2022; under U-margined perpetual contracts, 28 were delisted. On average, one delisting announcement every 28 days—delisting is accelerating.
Spot delistings target older coins, while contract delistings target newer ones. When spot was delisted, the median survival years rose from 4.1 years in 2022 to 5.1 years; for contracts it fell from 1.3 years to 0.8 years.
For tokens delisted from both Binance contracts and spot trading, the usual delisting path is from Perps to Spots.
What determines life or death is FDV and OI, not trading volume. Spot tokens with FDV below $10m: in 2026, 49% were delisted. With FDV above $100m: none was delisted. As for average daily trading value, even the $1m–$3m range still had 10.6% delisted. OI below 1m has a 31% delisting rate; above 20m it’s 0%.
Binance’s proprietary distribution channels provide no protection. Among contract tokens delisted in 2026, 63% came from Binance Alpha. Of 42 delisted spots, 11 came from Launchpool or Launchpad.
The data in this article comes from Binance’s official announcements, Binance exchange data, and CoinGecko. It covers all 144 spot delisting events and 150 contract delisting events from the full historical period between Feb 17, 2022 and Aug 11, 2026. Focusing mainly on Binance token delisting events in 2026, the goal is to analyze the淘汰 logic behind them: the key factors affecting token survival across dimensions such as token source, fully diluted valuation (FDV), and trading volume—providing quantitative references for secondary-market investors to identify delisting risk and for project teams to manage shelf listing.

In 2026, the number of spot assets delisted has hit a new high since 2022, and the delisting batches are accelerating
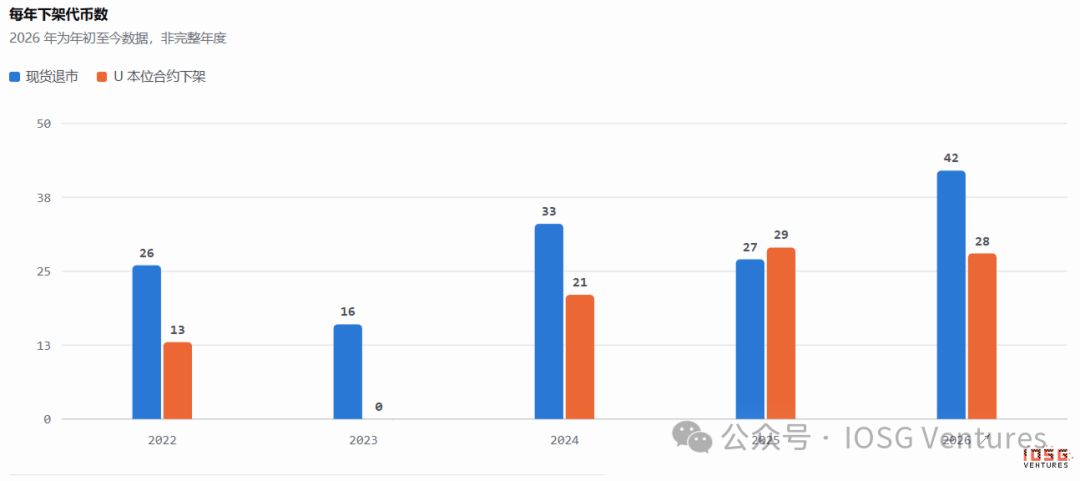
Spot 42, contracts 28—these are the delisting counts from the past 8 months. Spot delist has already exceeded the peak delisting count of the previous four years. Under the impact of the U.S. stock market, this data is expected to keep rising significantly by year-end.
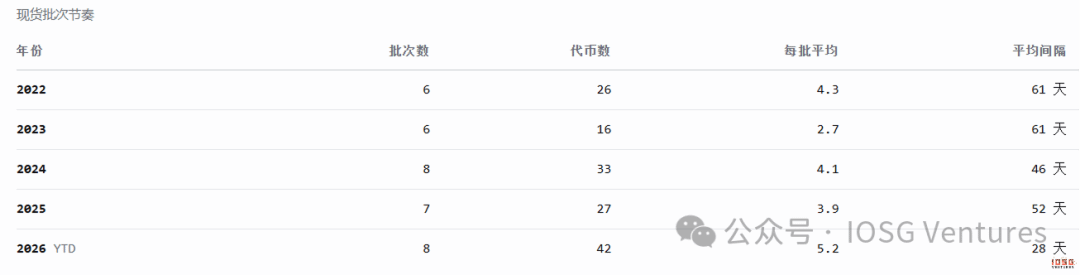
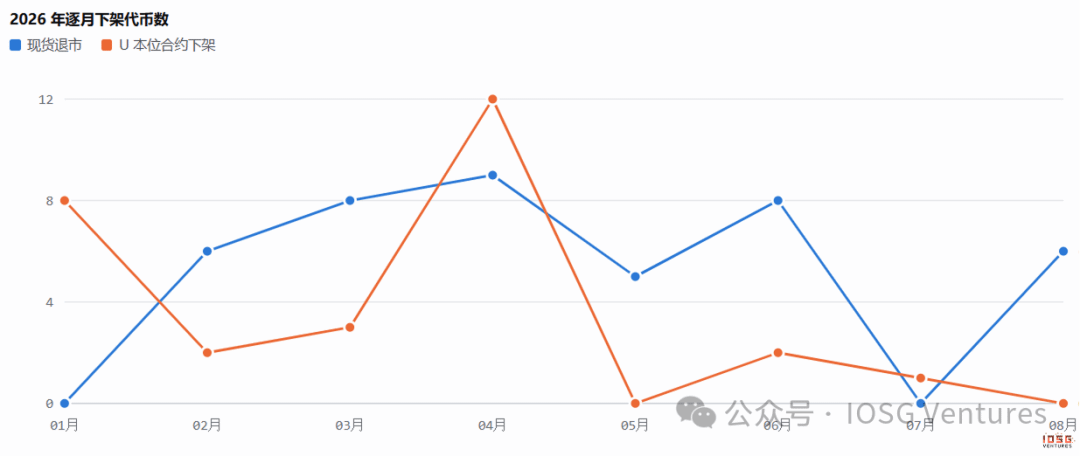
Delisting batches are accelerating: In 2026, the average batch cadence is one every 28 days, compared to only 52 days on average in 2025. Each batch delists more assets, with an average of more than 5 tokens per batch. The time intervals across eight announcement rounds range from 8 to 44 days. The shortest was two consecutive batches on April 9 and April 17, and the number of delisted tokens in a single month reached 9.

The more you cut spot, the older it gets; the more you cut perps, the newer it gets
Median survival years at the time of delisting: spot 4.1 years (2022) → 5.1 years (2026); contracts 1.3 years → 0.8 years. Of the 42 spot-delisted tokens, 31 were listed in 2021 or earlier; PIVX, FUN, and LRC each lasted 8.6 years. All 28 contract delisting events came from contracts listed after 2024; of these, 23 were listed in 2025, and 11 didn’t last beyond half a year.

Same exchange, but the淘汰 logic of the two shelves is the opposite.
Historically, Binance Asset Security has listed 1,114 assets. Of these, 284 were listed on spot only, 474 were listed on both spot and contracts, and 356 were listed on contracts only. Among the contract tokens delisted in 2026, 93% were never listed on spot—they never entered that spot pool which requires custody, node maintenance, and compliance commitments.
The contract layer is a low-commitment quote layer: cash settlement, no custody required, and no form of endorsement. So it can quickly list a hot narrative, then quickly remove it. The spot layer is a custody-and-endorsement layer: every coin listed means long-term wallet custody, node maintenance, and compliance responsibilities. The delisting cadence differs between the two shelves because the “cost” paid at listing is inherently different.
Therefore, look at these two lines together: Spot delisting is clearing out historical inventory, while contract delisting is withdrawing exposure to speculation and trial-and-error.

Delisting path: From Perps to Spot
Statistics on projects that were delisted from one of two shelves:
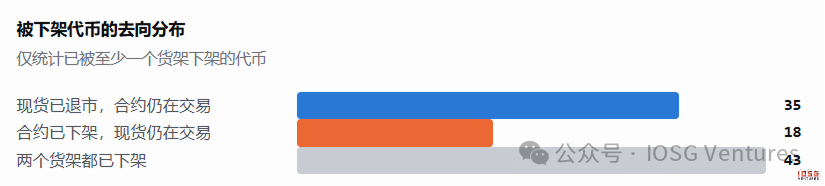
There are 35 cases where spot has been delisted but contracts are still trading; the reverse situation has only 18 cases. There are 43 cases where both shelves were delisted.
Cut spot and you save the real operational costs, while also reducing regulatory and reputational exposure. Cut contracts and you don’t save money—you give up a potential return, including volatility, funding rates, and liquidation risk. Even an asset whose fundamentals have already played out can still make money as a pure financial derivative.

Which projects are disappearing
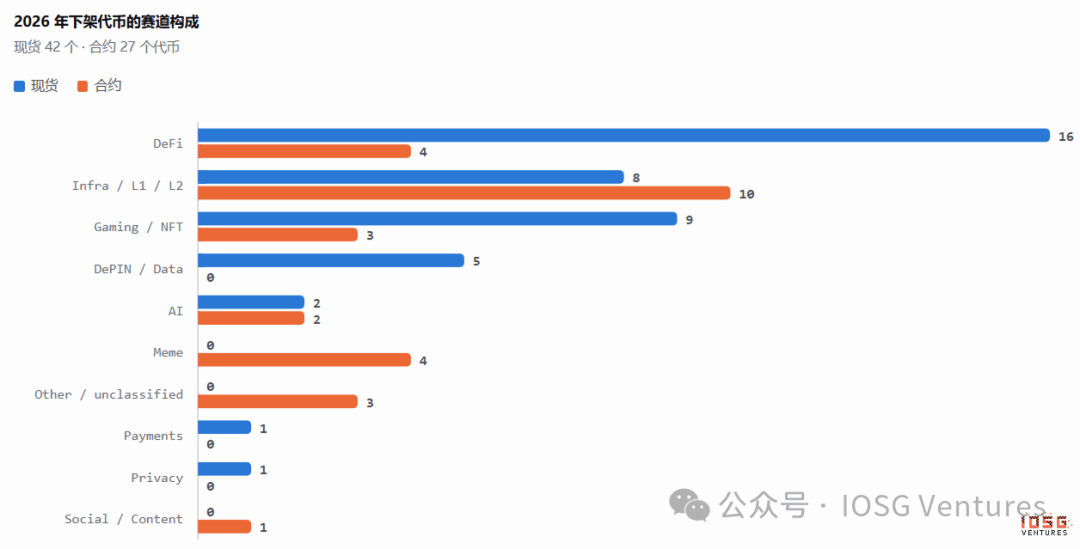
In 2026, the composition of spot delisting sectors: 16 DeFi (38%), 9 Gaming/NFT (21%), 8 Infra/L1/L2, and 5 DePIN/Data. The first two categories total close to 60%, and the vast majority are assets listed in 2020–2021. Of the 42, 20 are concentrated in those two years.
The contracts side is completely different: 10 in Infra/L1/L2, 4 in DeFi, and 4 in Meme. What it mainly clears is the narrative from the last two years.
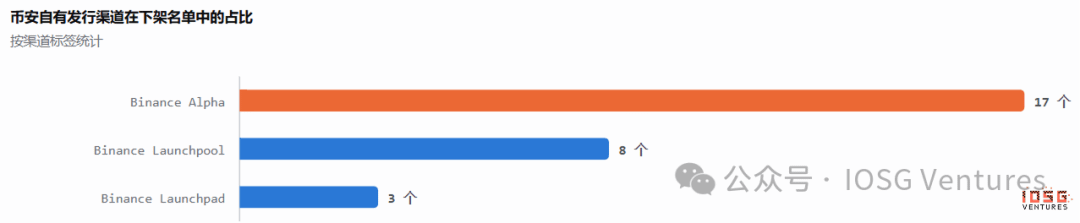
Binance’s proprietary distribution channels take up a significant share on the list. Among contract tokens delisted in 2026, 63% came from Binance Alpha Spotlight, including ZKJ, PUFFER, TANSSI, and YALA. Of the 42 spot delisted assets, 11 (26%) came via Launchpool or Launchpad, including NTRN, RDNT, HIGH, MBOX, and HFT. The most extreme case is A2Z, a Launchpad project: listed on spot in July 2025, delisted in April 2026—survived for only 8 months.
Getting it via Alpha or Launchpool is a one-time distribution and a burst of exposure, not a long-term seat.

What determines life or death is FDV and OI, not trading volume
For Binance spot, put the delisted tokens in 2026 and the tokens that were still listed at that time into the same bins. Then compute and compare the delisting proportion in each bin using FDV and trading value indicators.
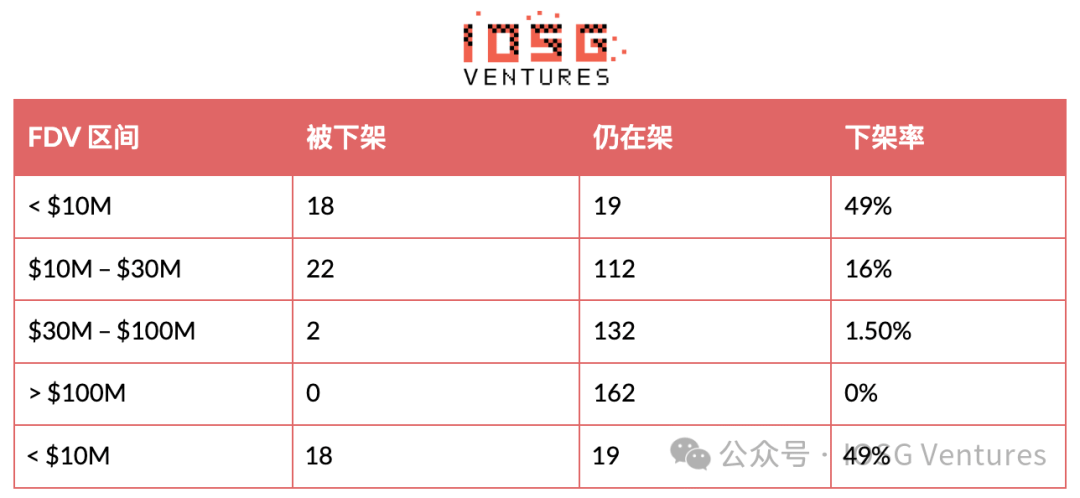
Spot delisting rate by FDV
Spot delisting rate by average daily trading value
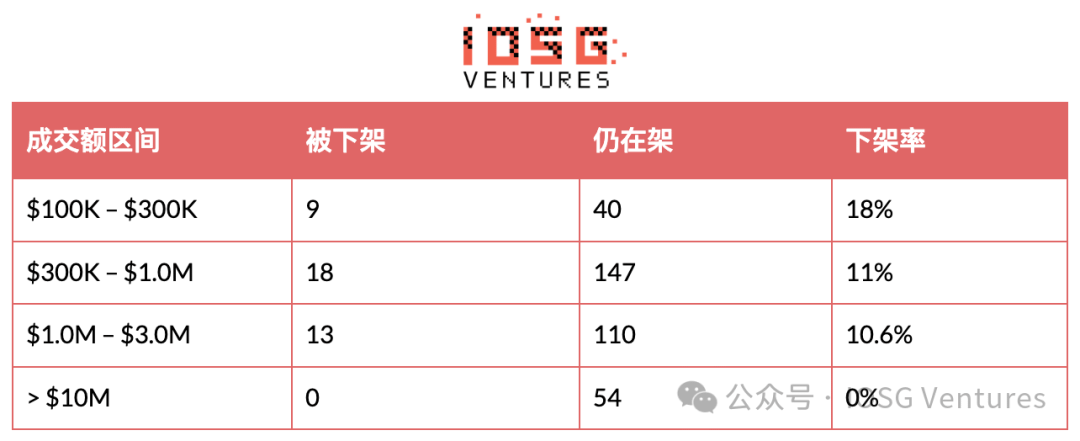
The FDV differentiation for delisted projects is very clear. With FDV threshold at 10m, the delisting rate drops from 49% to 16%—and the change crosses two orders of magnitude. Trading value between 100k m and 3m is almost a flat line, and the delisting rate stays between 10% and 18%. The quartiles show the same pattern: for spot, the median FDV of the delisted group is $10.53m, while that of the listed group is $56.88m—a difference of 5.4x. The median trading value is $0.65m versus $1.19m—only a 1.8x difference.
On the contracts side, we mainly focus on the Open Interest (OI) indicator
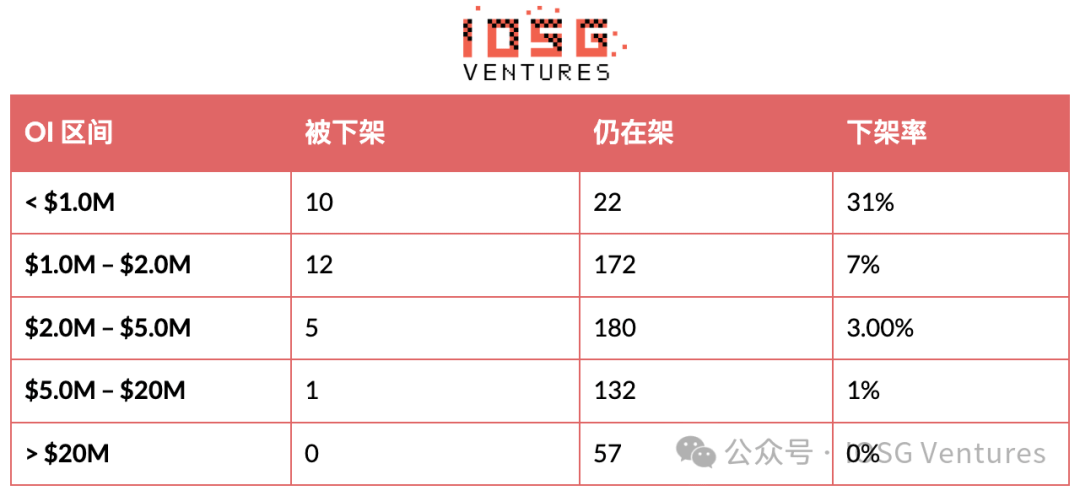
U-denominated contracts: delisting rate by open interest (OI) amount
U-denominated contracts: delisting rate by average daily contract trading value
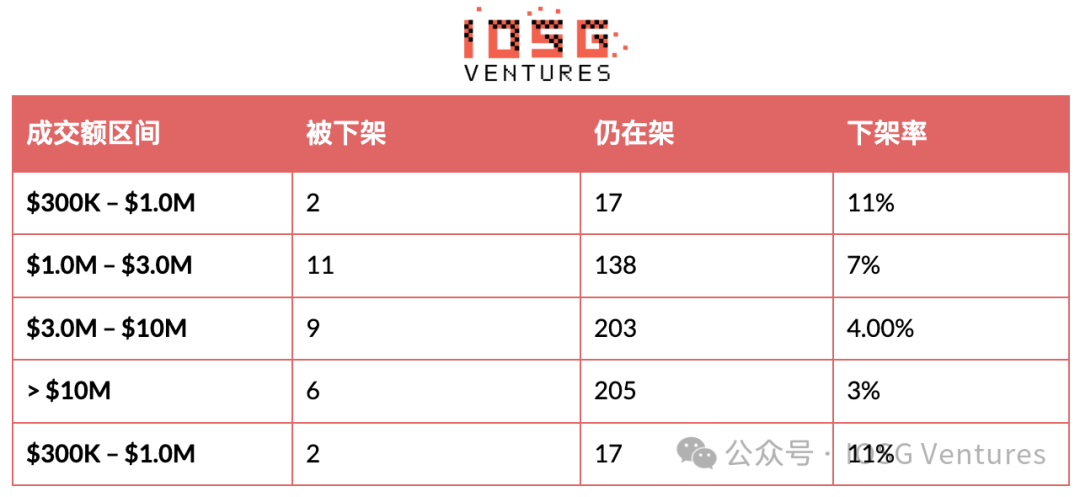
The delisting rate for OI below 1m is 31%, and for above 20m it’s 0%. The median OI of the delisted group is 1.21m, while the not-delisted group is 3.13m. Meanwhile, within the contract trading value range above 100m, 2.8% are still being delisted. Before COMMON announcements, the average daily trading volume was 29.35m and RVV trading volume was 2.854m—yet Binance contracts removed them anyway.
Trading volume is easy to fake (Wash Trading), inflate via high-frequency quant trading, or create a false appearance through frequent short-term rotation. Even if daily trading volume shows millions of dollars, it may just be “turning noise” on a tiny low-cost liquidity pool that can’t reflect the asset’s true health. By contrast, FDV represents the project’s overall capital lock-in and a base that resists sell pressure—determining the spot market’s ability to absorb demand. OI represents the real margin locked on the book and the funds used for actual speculation—determining contract depth and risk-control safety. Therefore, FDV and OI are the hardest indicators for reflecting an asset’s long-term survival value and risk floor.

Inspiration
#
For project teams: Value capital and liquidity lock-in—abandon fake volume inflation
Abandon fake volume inflation: Trading volume can’t cover liquidity collapse. Trading volume manufactured by market makers and quant wash-trading can’t serve as a shield—risk control only cares about capital retention.
守住 FDV/OI 防线:现货须维持项目市值与资本沉淀(FDV 保持在 $10M 以上);合约须引入真实对冲与博弈资金(OI 保持在 $1.0M 以上)。
Channel exposure isn’t a shield: Binance Alpha or Launchpool/pad only provides initial visibility. After listing, if there’s no real ecosystem and liquidity pool, they will be rapidly delisted.
#
For investors: Beware of fake liquidity—track hard risk-control metrics
Avoid the high-volume trap: Be cautious about assets with high trading volume but low FDV or low OI. Such assets are often false appearances created by volume wash-faking, and they face liquidation and delisting risk at any time.
Set a delisting early-warning red line: Use spot FDV < $10M and contract OI < $1.0M as high-risk delisting thresholds. Close positions or reduce leverage in time to avoid liquidity discounting and liquidation losses due to going under.
Different logic for shelf-victimization: For established DeFi/Gaming projects, shrinking FDV requires guarding against spot delisting. For new narrative projects from the last two years, if contract OI is scarce, guard against a chain sell-off caused by derivatives delisting.