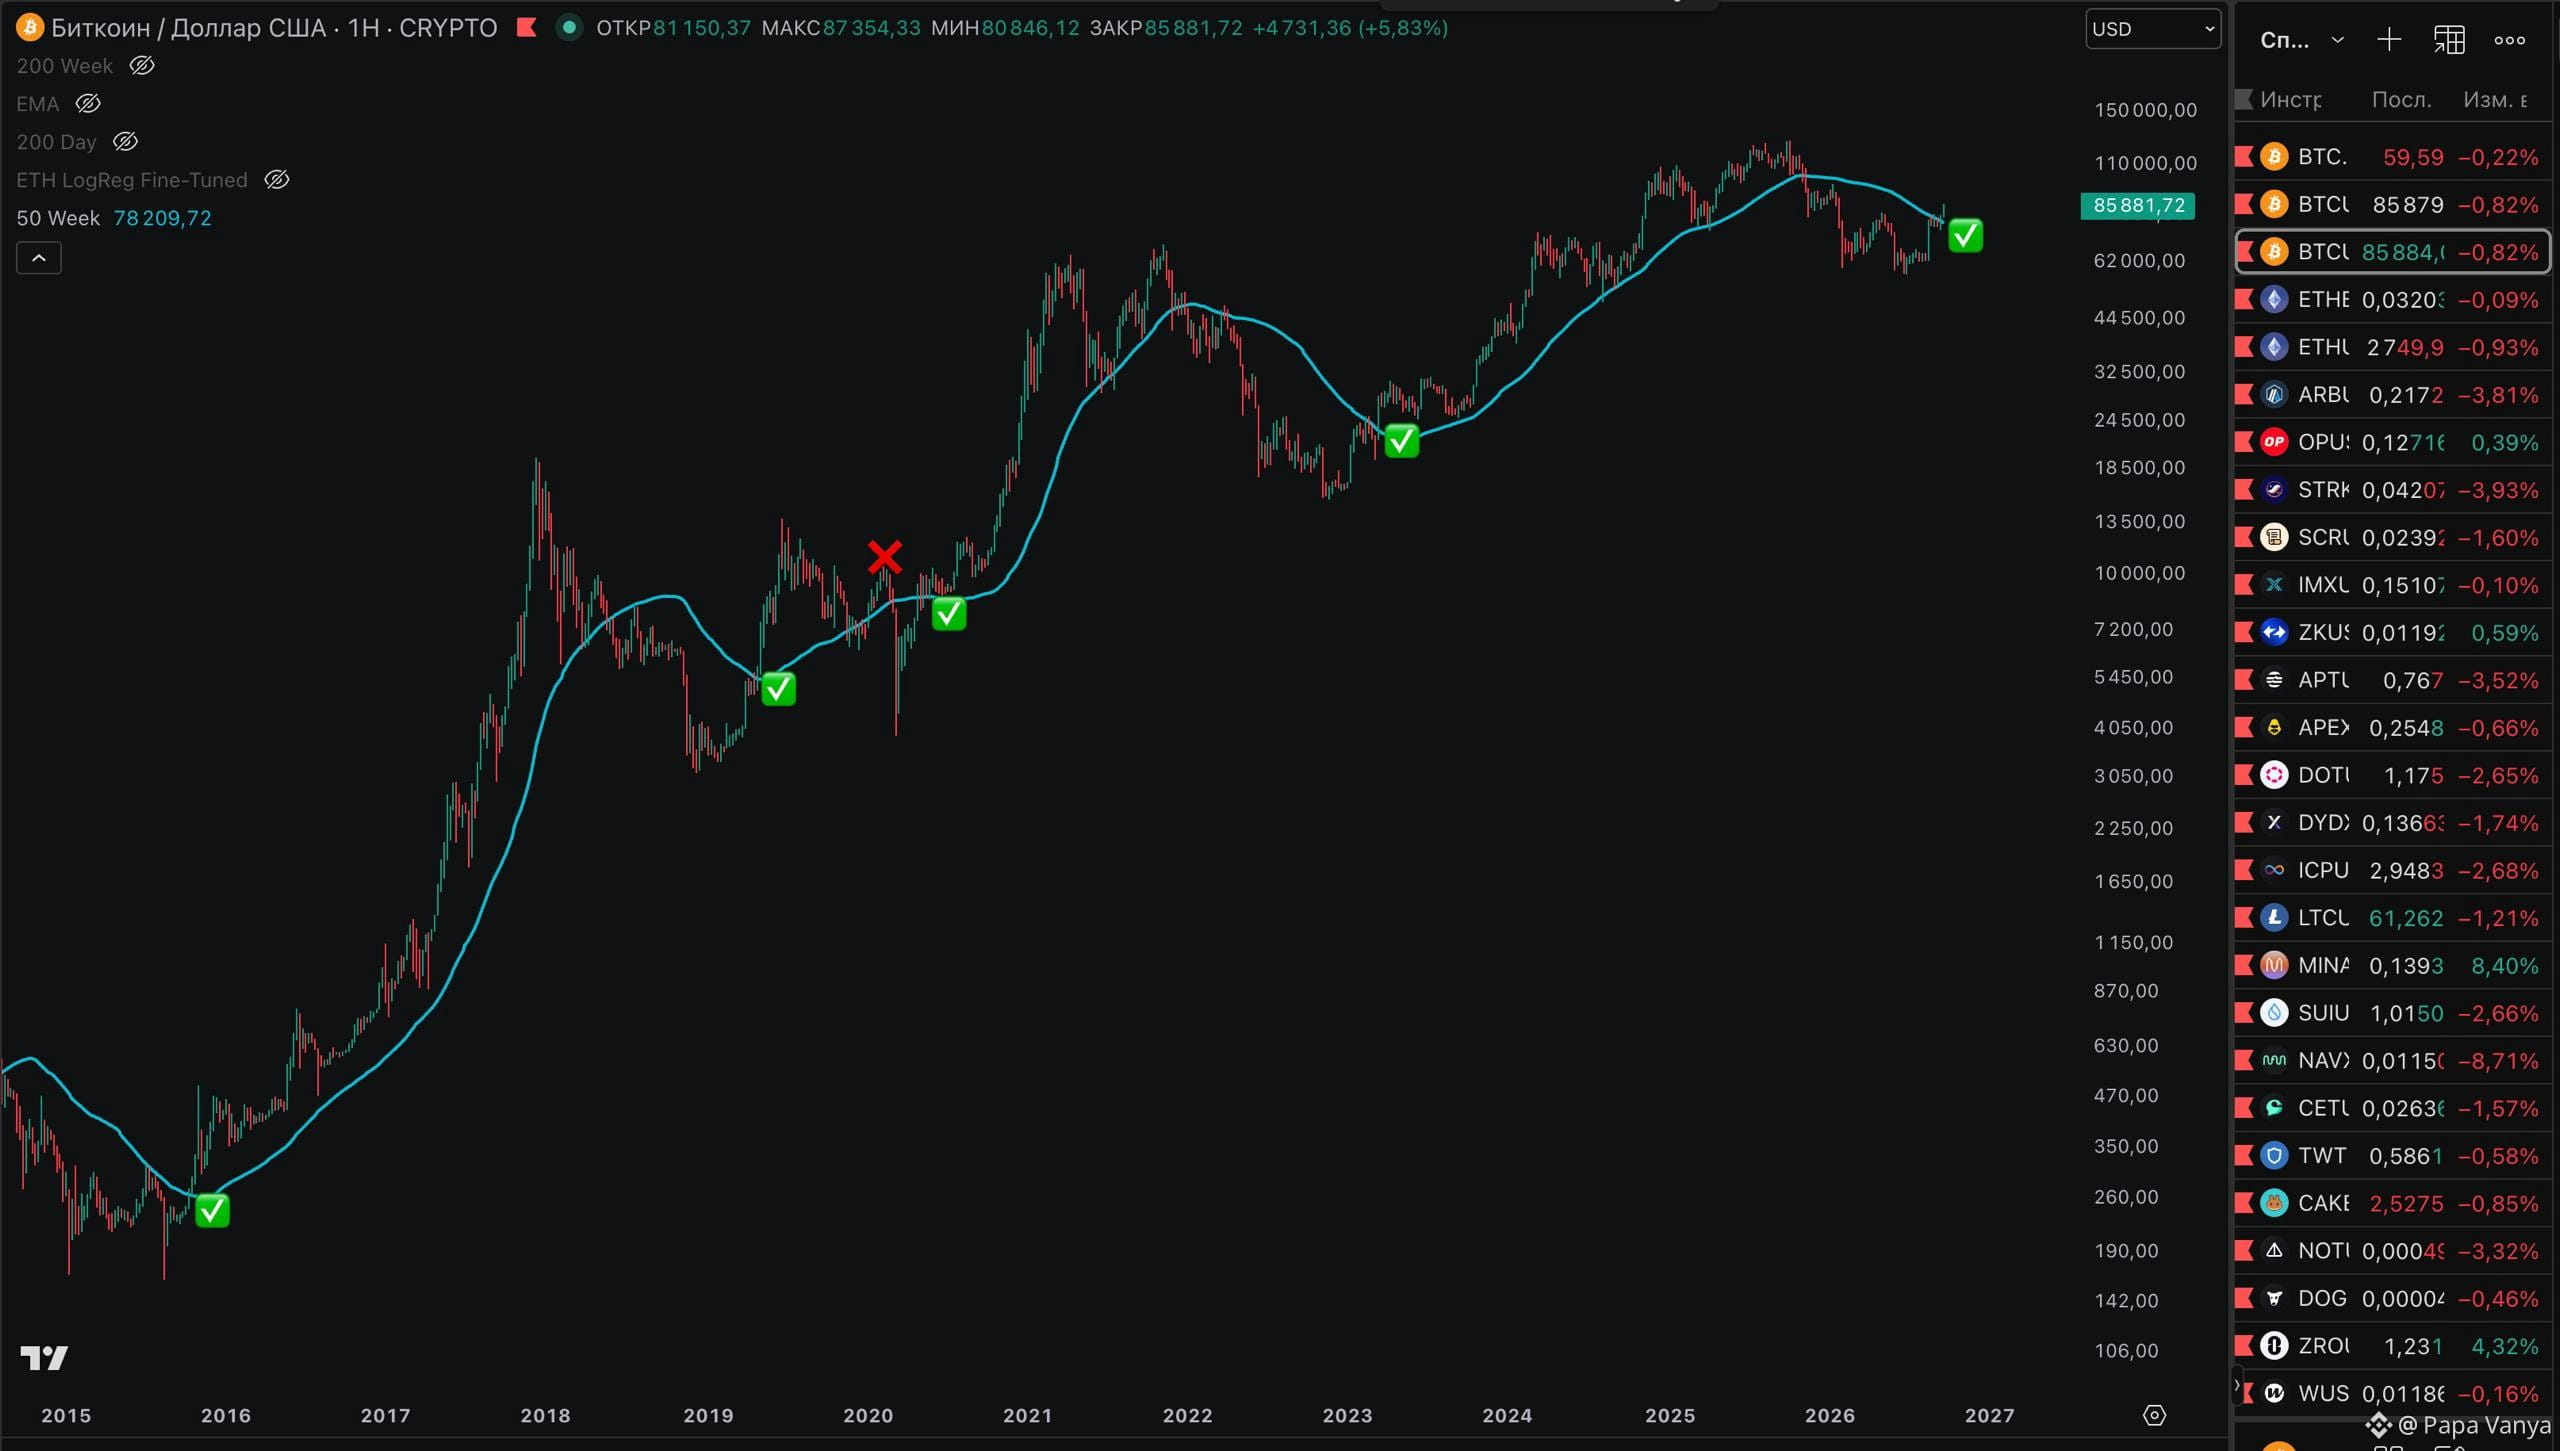
Bitcoin for the first time since November 2025 closed the week above the 50-week moving average!
As we discussed earlier: this line on the chart is one of the first signals of a possible shift in market structure, a turning point between bullish/bearish market phases.
Now, after BTC broke above $82k, the weekly chart structure is starting to change in the opposite direction.
Of course, the current week hasn’t closed yet. But if Bitcoin can manage to hold above this level, for me it will be the second major trend-change signal (after the first one).
The third, most interesting one will appear later—when, after the current move, the market pulls back in a correction, but the next low forms higher than the previous one.
In essence, this will be the first complete higher low and a classic bullish structure already: higher high — higher low. Ideally, this would be the case if the 2020 scenario doesn’t play out.
As we discussed earlier: this line on the chart is one of the first signals of a possible shift in market structure, a turning point between bullish/bearish market phases.
Now, after BTC broke above $82k, the weekly chart structure is starting to change in the opposite direction.
Of course, the current week hasn’t closed yet. But if Bitcoin can manage to hold above this level, for me it will be the second major trend-change signal (after the first one).
The third, most interesting one will appear later—when, after the current move, the market pulls back in a correction, but the next low forms higher than the previous one.
In essence, this will be the first complete higher low and a classic bullish structure already: higher high — higher low. Ideally, this would be the case if the 2020 scenario doesn’t play out.