#SUI Next few months’ K-line action is worth paying close attention to. From the daily chart to the weekly chart, the market structure across each timeframe has fully shifted to a bullish setup.
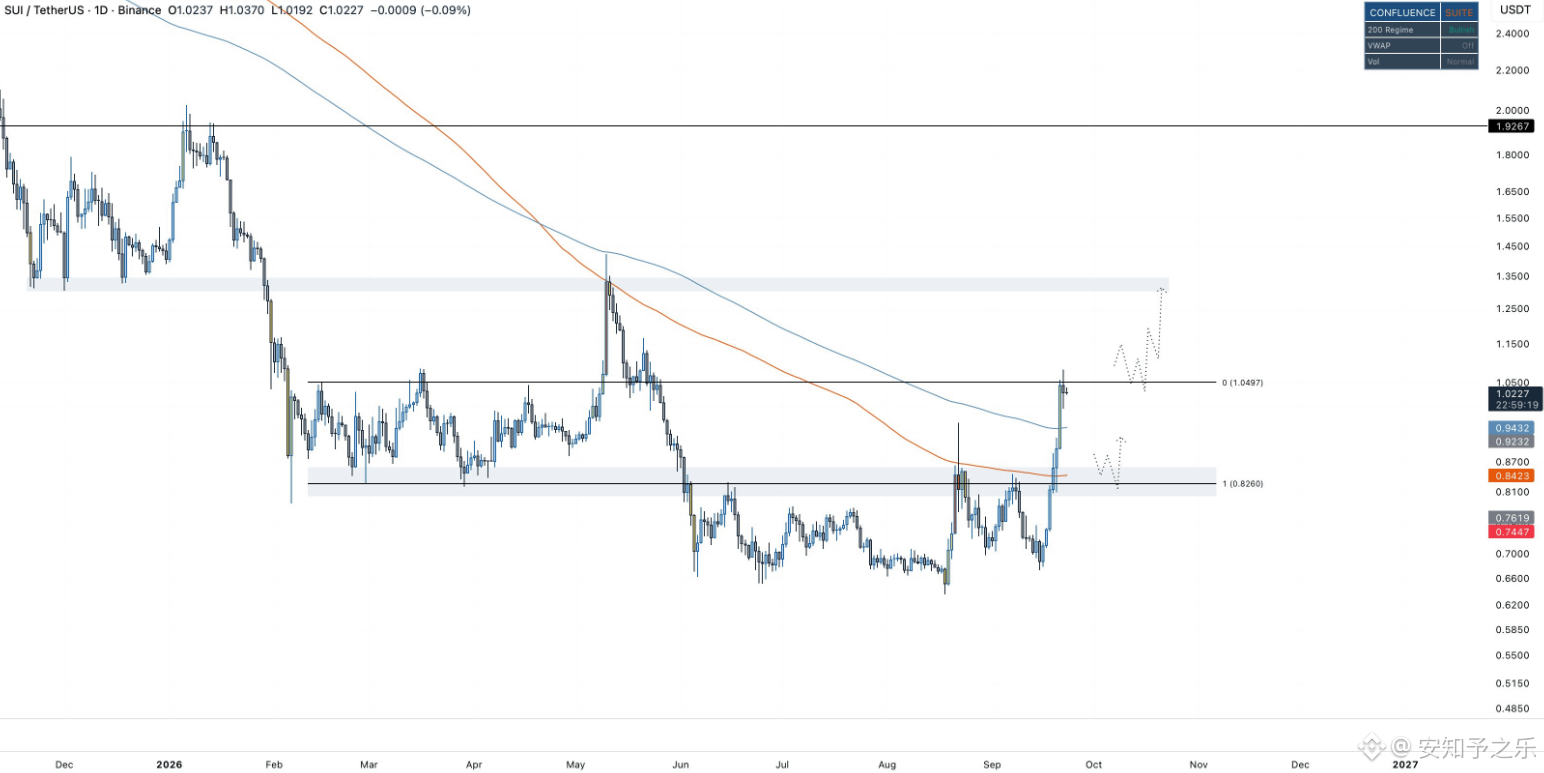
The daily chart has formed a very standard AMD pattern. Price first dips to sweep the low-level positions in the 0.64–0.68 USD range, then strongly recovers the core 0.80–0.85 USD support/resistance zone, and rallies all the way to the RH level at 1.05 USD. It is currently stalling here.
For the next move, as long as the market pulls back to around 0.85 USD, it becomes a good opportunity to set up spot positions.
Once price breaks upward through this RH resistance level, the upside targets will be 1.41 USD, and then 1.92 USD.
1.92 USD is a macro-level key support/resistance area. Whether it succeeds or fails at this level will determine whether the market continues with sideways consolidation at low levels, or instead directly launches an attack toward new historical highs.
The daily chart has formed a very standard AMD pattern. Price first dips to sweep the low-level positions in the 0.64–0.68 USD range, then strongly recovers the core 0.80–0.85 USD support/resistance zone, and rallies all the way to the RH level at 1.05 USD. It is currently stalling here.
For the next move, as long as the market pulls back to around 0.85 USD, it becomes a good opportunity to set up spot positions.
Once price breaks upward through this RH resistance level, the upside targets will be 1.41 USD, and then 1.92 USD.
1.92 USD is a macro-level key support/resistance area. Whether it succeeds or fails at this level will determine whether the market continues with sideways consolidation at low levels, or instead directly launches an attack toward new historical highs.