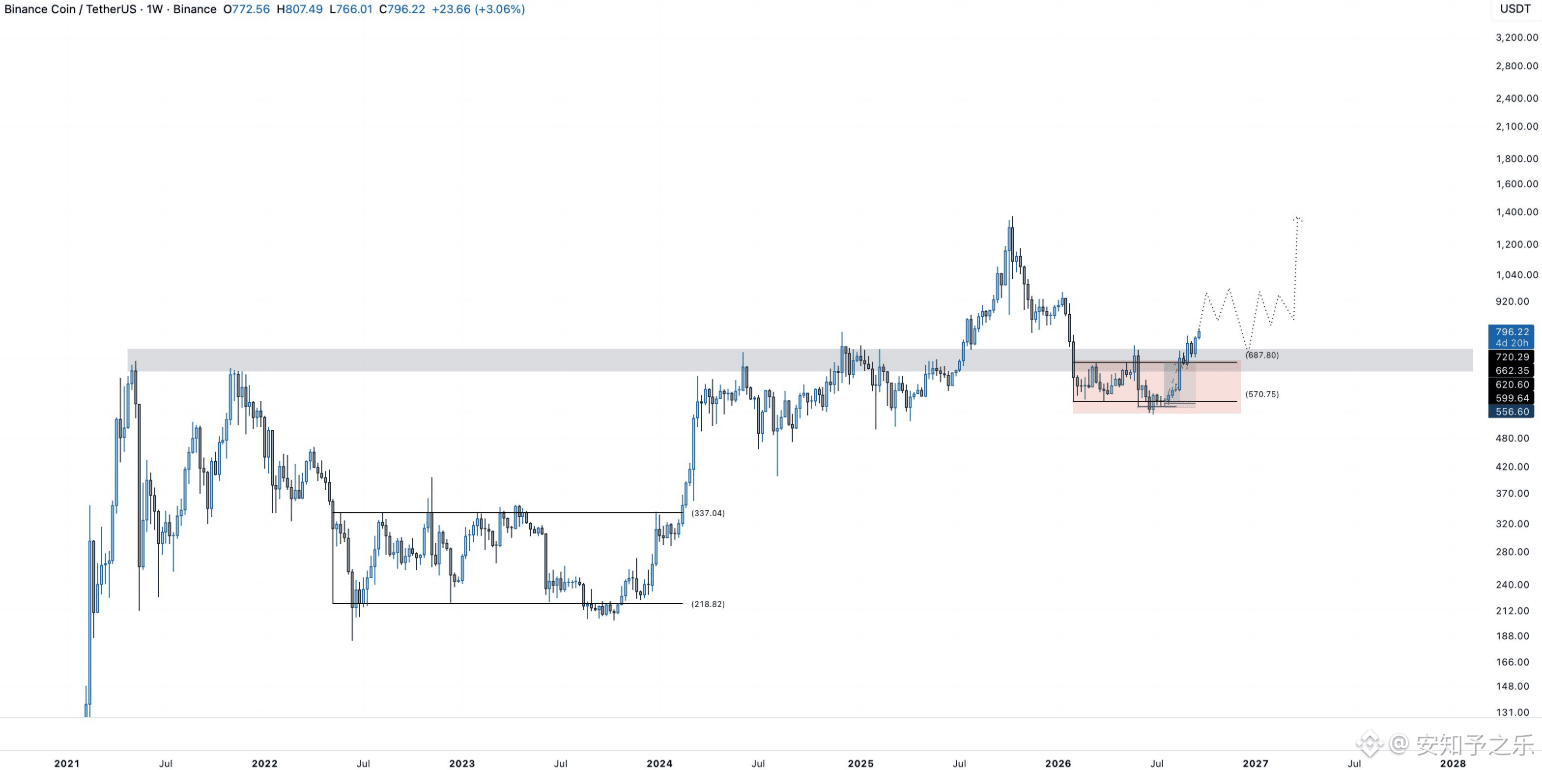
#BNB , it can be said to be one of the cleanest chart patterns among all crypto assets at the moment. In July, we placed long positions at the bottom within the $560 to $700 range. This move has been especially well-structured, and it instantly doubled my confidence in also positioning for the BTC bottom.
Looking at the weekly timeframe: the price moved below a key weekly support/resistance level while forming a divergence. After the stop-out of the liquidity sweep, it used a false breakout to shake out the positions of those who were holding. Once the price reclaims and breaks above this level, this bull-trap is officially confirmed.
As long as the divergence structure remains intact, then if there is a retest of the weekly support/resistance zone at $680–$750 afterward, it would be a solid spot long-term entry point.
But do watch the risk: if the weekly candle closes below $680, then this bullish thesis is invalidated.
Looking at the weekly timeframe: the price moved below a key weekly support/resistance level while forming a divergence. After the stop-out of the liquidity sweep, it used a false breakout to shake out the positions of those who were holding. Once the price reclaims and breaks above this level, this bull-trap is officially confirmed.
As long as the divergence structure remains intact, then if there is a retest of the weekly support/resistance zone at $680–$750 afterward, it would be a solid spot long-term entry point.
But do watch the risk: if the weekly candle closes below $680, then this bullish thesis is invalidated.