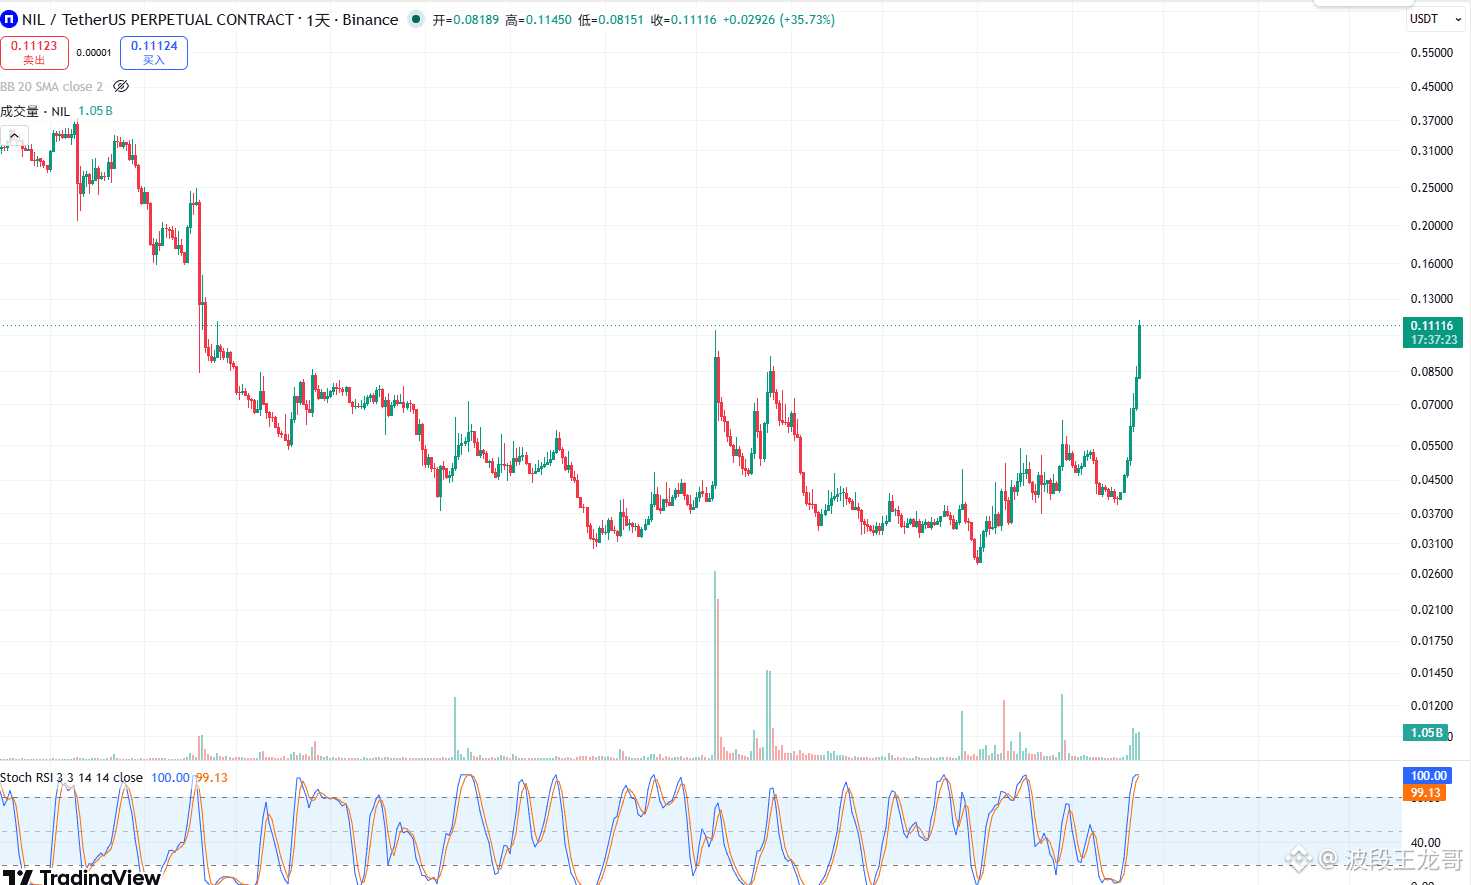
NIL weekly chart saw one big bullish candle up 80%. The daily then surged another 35%, topping out at 0.1145— is this a bottom reversal, or just a previous high wick/pin?
The weekly opened at 0.062, high 0.1145, low 0.059. The daily opened at 0.082, and the 4-hour already touched that wick at the previous high. Weekly RSI is 85/85, daily is directly 100/99—overbought. Volume has come in, but it’s perfectly hitting the old neckline at 0.11. The green line is at 0.111—this is the neck right now.
NIL is Nillion—the privacy computing track, not a pure dog coin. But the candlestick behavior is the same as typical alts: first a slow bleed down to 0.03, then a pulse surge for a retracement back to the prior high. The rally is driven by expectations and funds; the drop depends on whether 0.11 can be broken.
In terms of structure: 0.03 is the major bottom. 0.045–0.055 is the first consolidation zone. 0.08 is the launch area. 0.11–0.12 is the near-term resistance in front of us. Above 0.20 is where the much earlier top is. Only if it goes above 0.115 and the weekly closes firmly can there be new room. If it can’t, it’s the standard pullback after retesting the previous high.
Short-term plan:
Short-term: Don’t chase if it’s at 0.111. First, see whether 0.1145 can close solidly; if there’s a long upper wick, reduce.
Entry points: 0.078–0.088 (pullback to the launch platform). If it breaks below 0.058, this rebound is over.
Note: A daily close back below 0.095, and it can’t get back above 0.105. Wicks intraday don’t count.
$NIL
The weekly opened at 0.062, high 0.1145, low 0.059. The daily opened at 0.082, and the 4-hour already touched that wick at the previous high. Weekly RSI is 85/85, daily is directly 100/99—overbought. Volume has come in, but it’s perfectly hitting the old neckline at 0.11. The green line is at 0.111—this is the neck right now.
NIL is Nillion—the privacy computing track, not a pure dog coin. But the candlestick behavior is the same as typical alts: first a slow bleed down to 0.03, then a pulse surge for a retracement back to the prior high. The rally is driven by expectations and funds; the drop depends on whether 0.11 can be broken.
In terms of structure: 0.03 is the major bottom. 0.045–0.055 is the first consolidation zone. 0.08 is the launch area. 0.11–0.12 is the near-term resistance in front of us. Above 0.20 is where the much earlier top is. Only if it goes above 0.115 and the weekly closes firmly can there be new room. If it can’t, it’s the standard pullback after retesting the previous high.
Short-term plan:
Short-term: Don’t chase if it’s at 0.111. First, see whether 0.1145 can close solidly; if there’s a long upper wick, reduce.
Entry points: 0.078–0.088 (pullback to the launch platform). If it breaks below 0.058, this rebound is over.
Note: A daily close back below 0.095, and it can’t get back above 0.105. Wicks intraday don’t count.
$NIL