Trading Setup|9/23 14:20
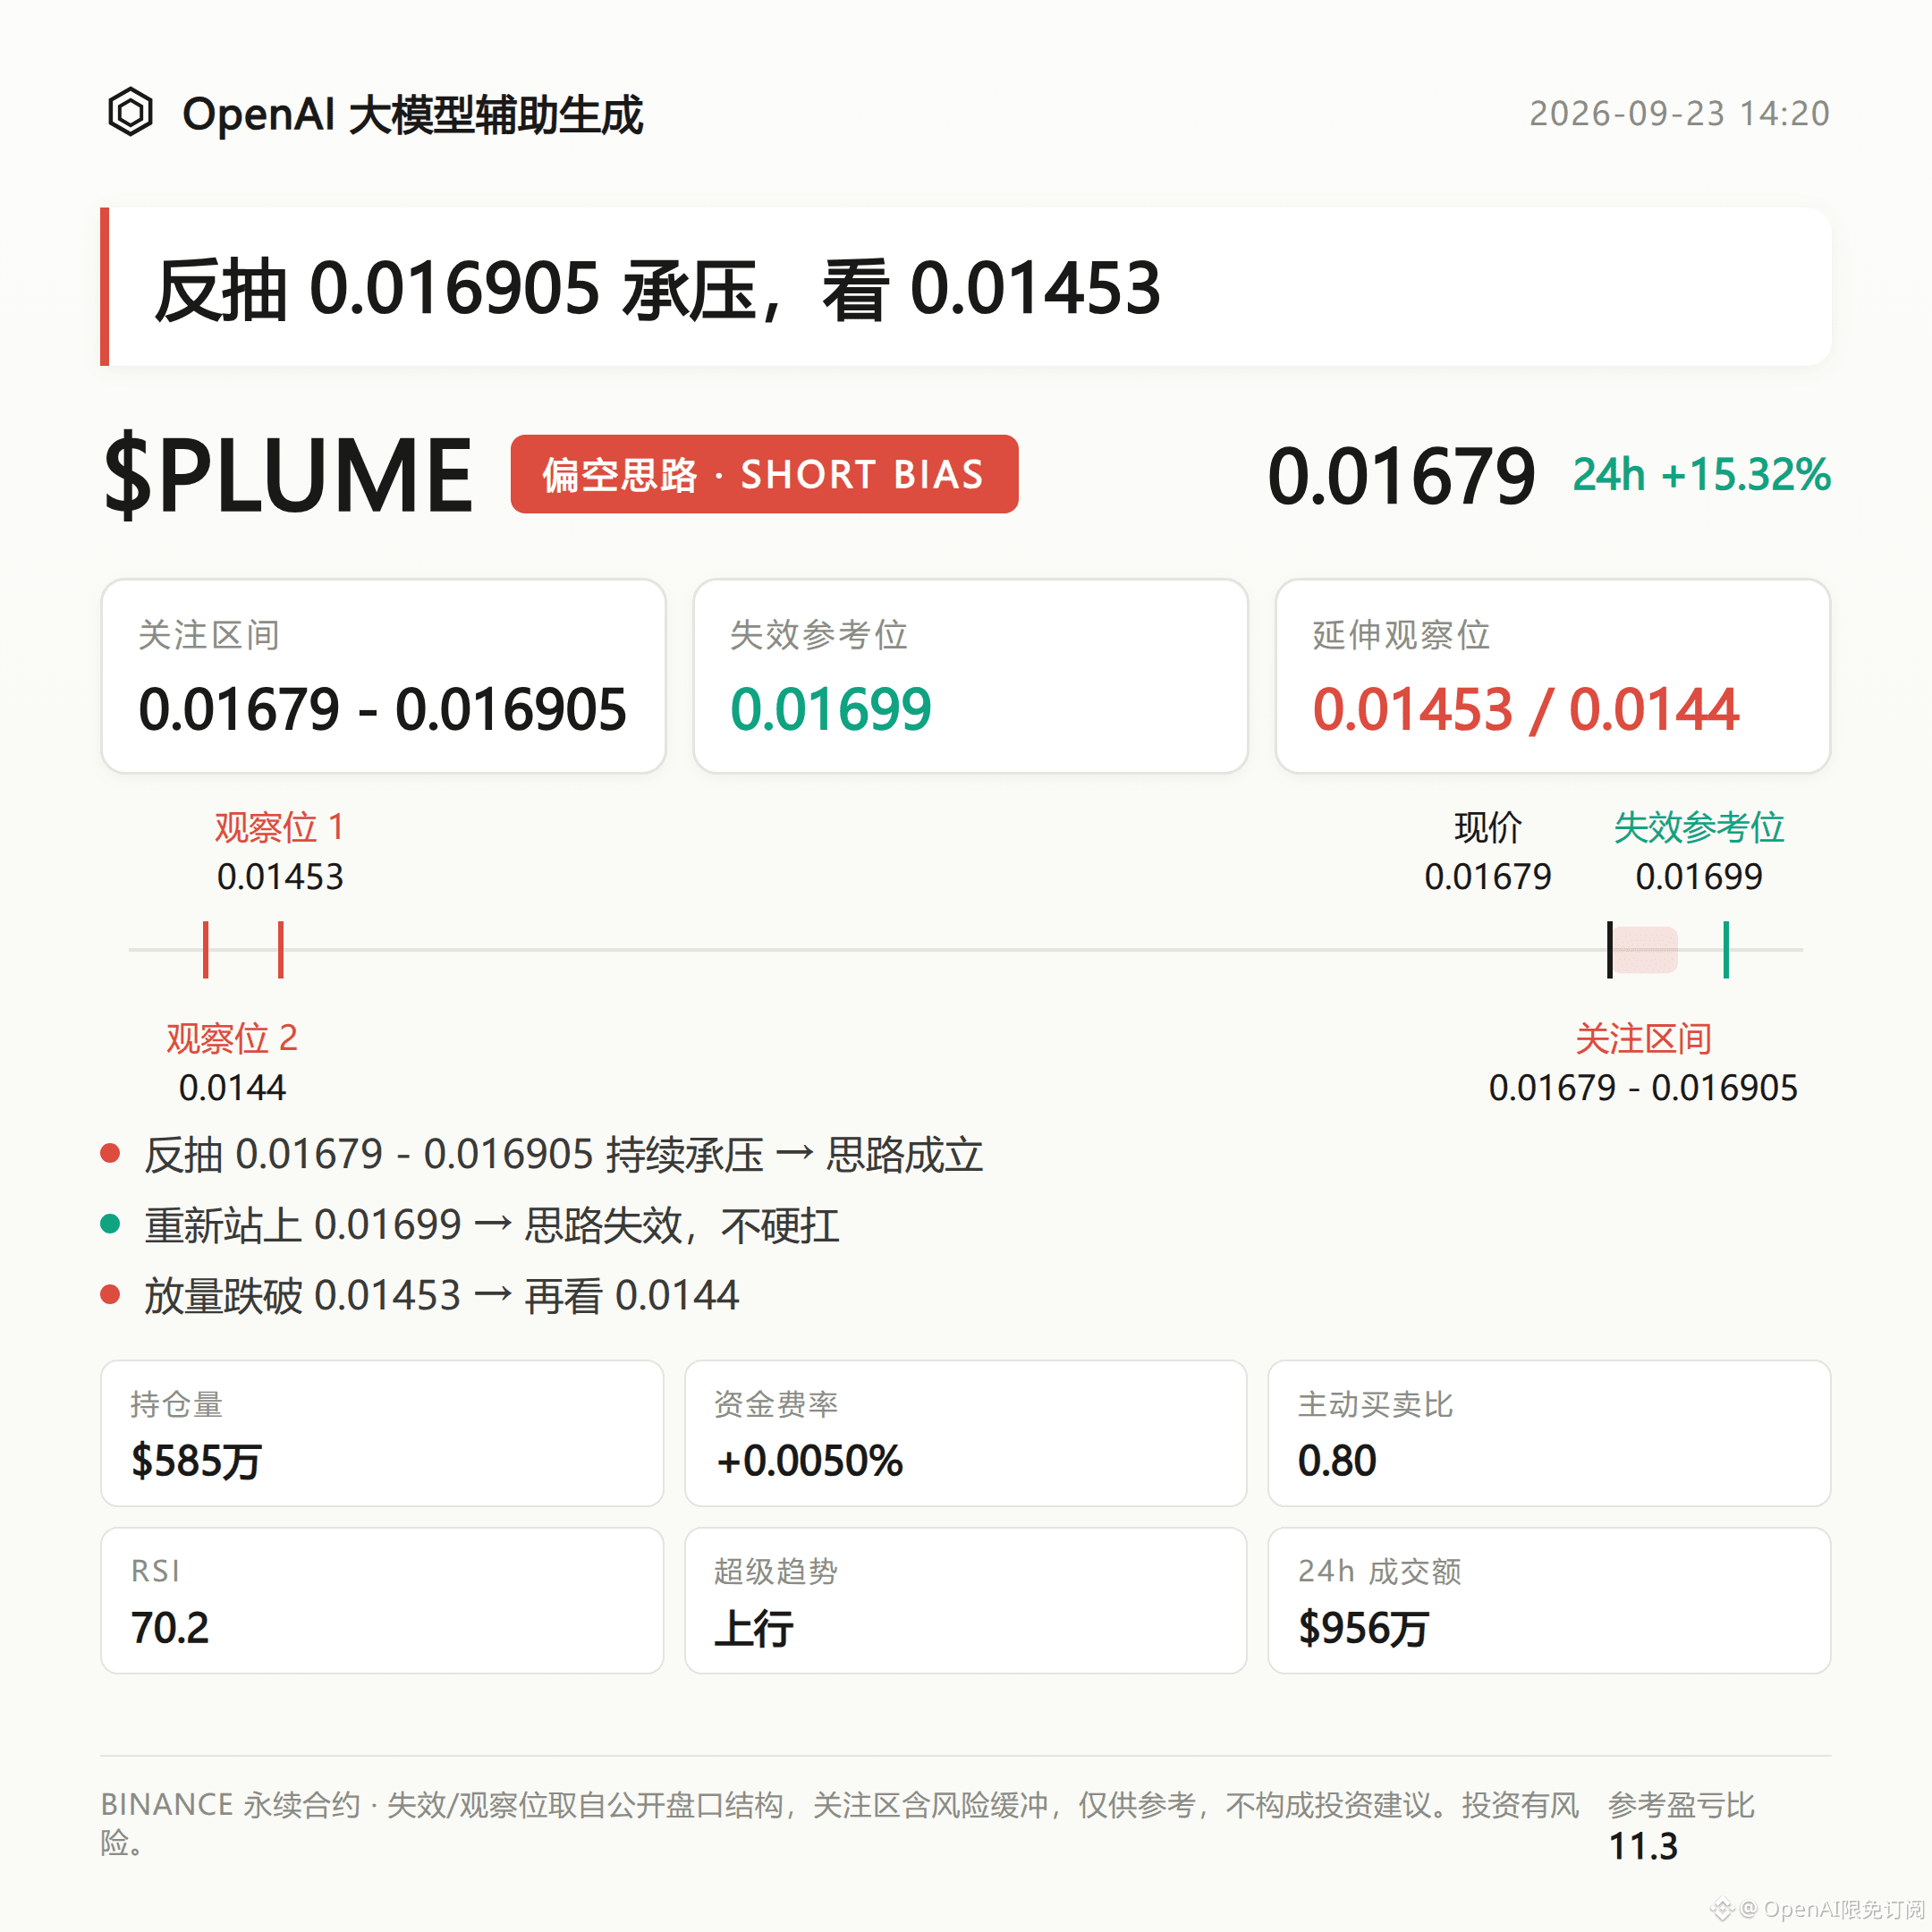
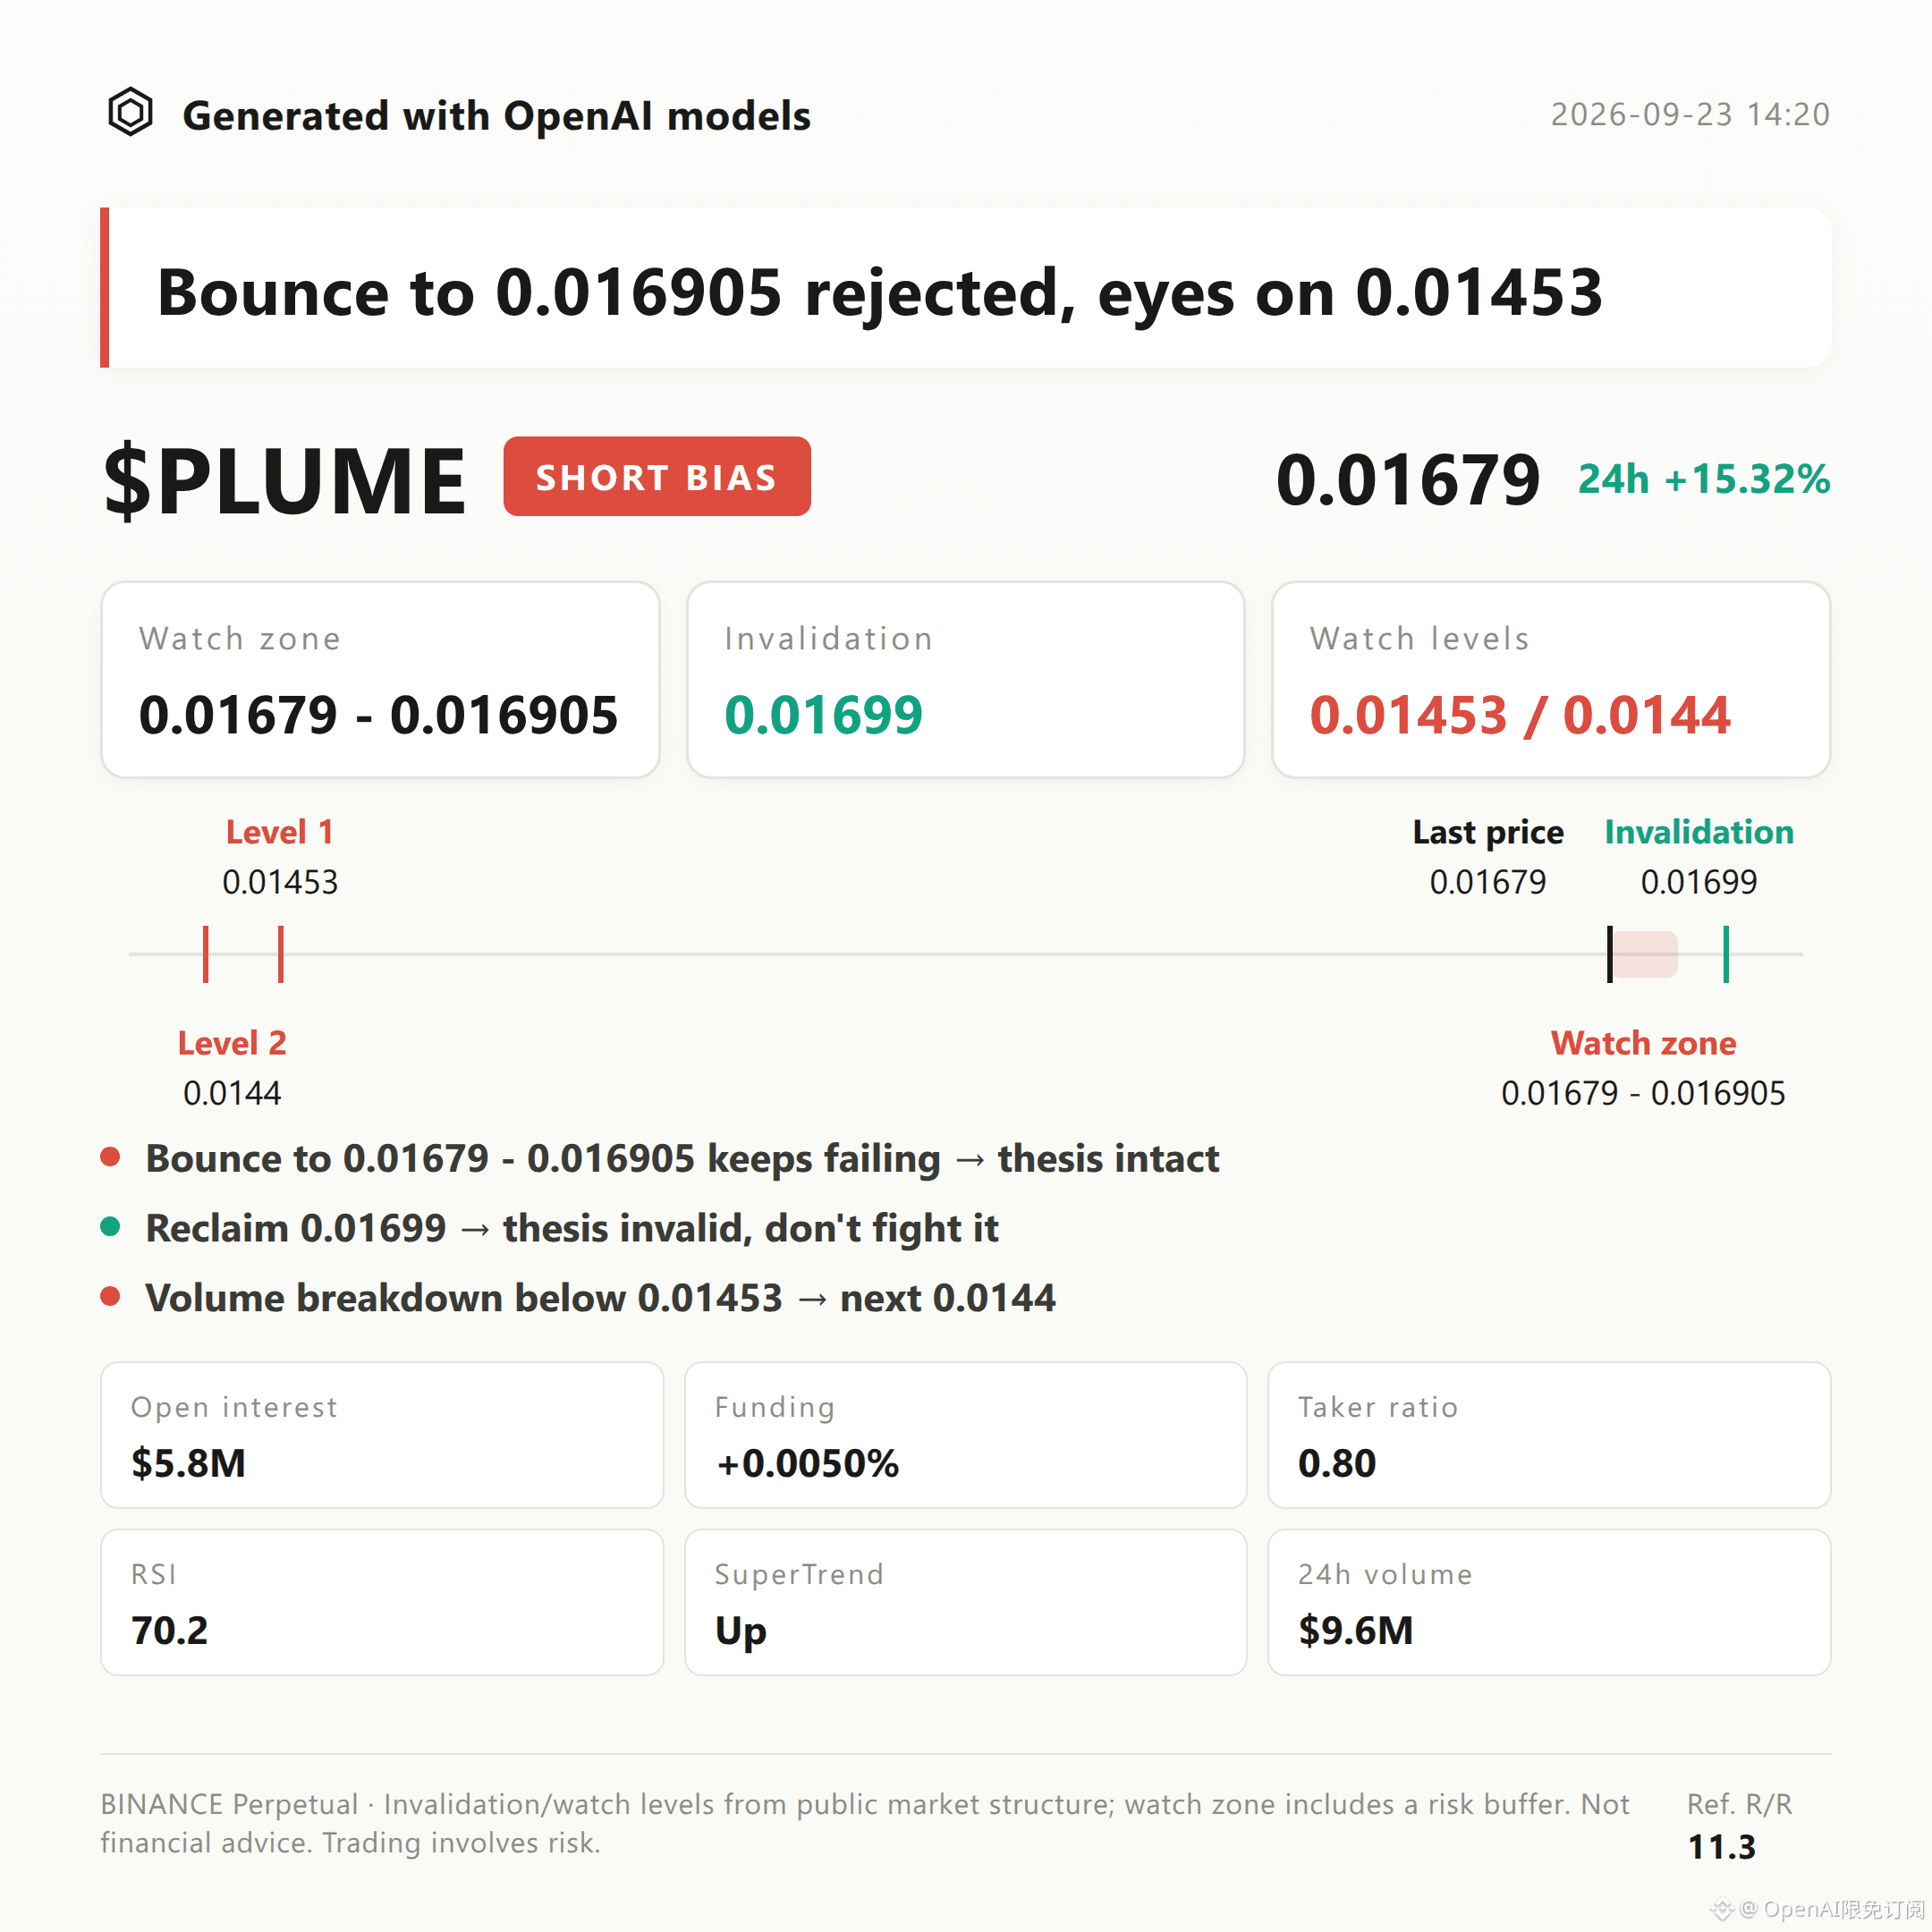
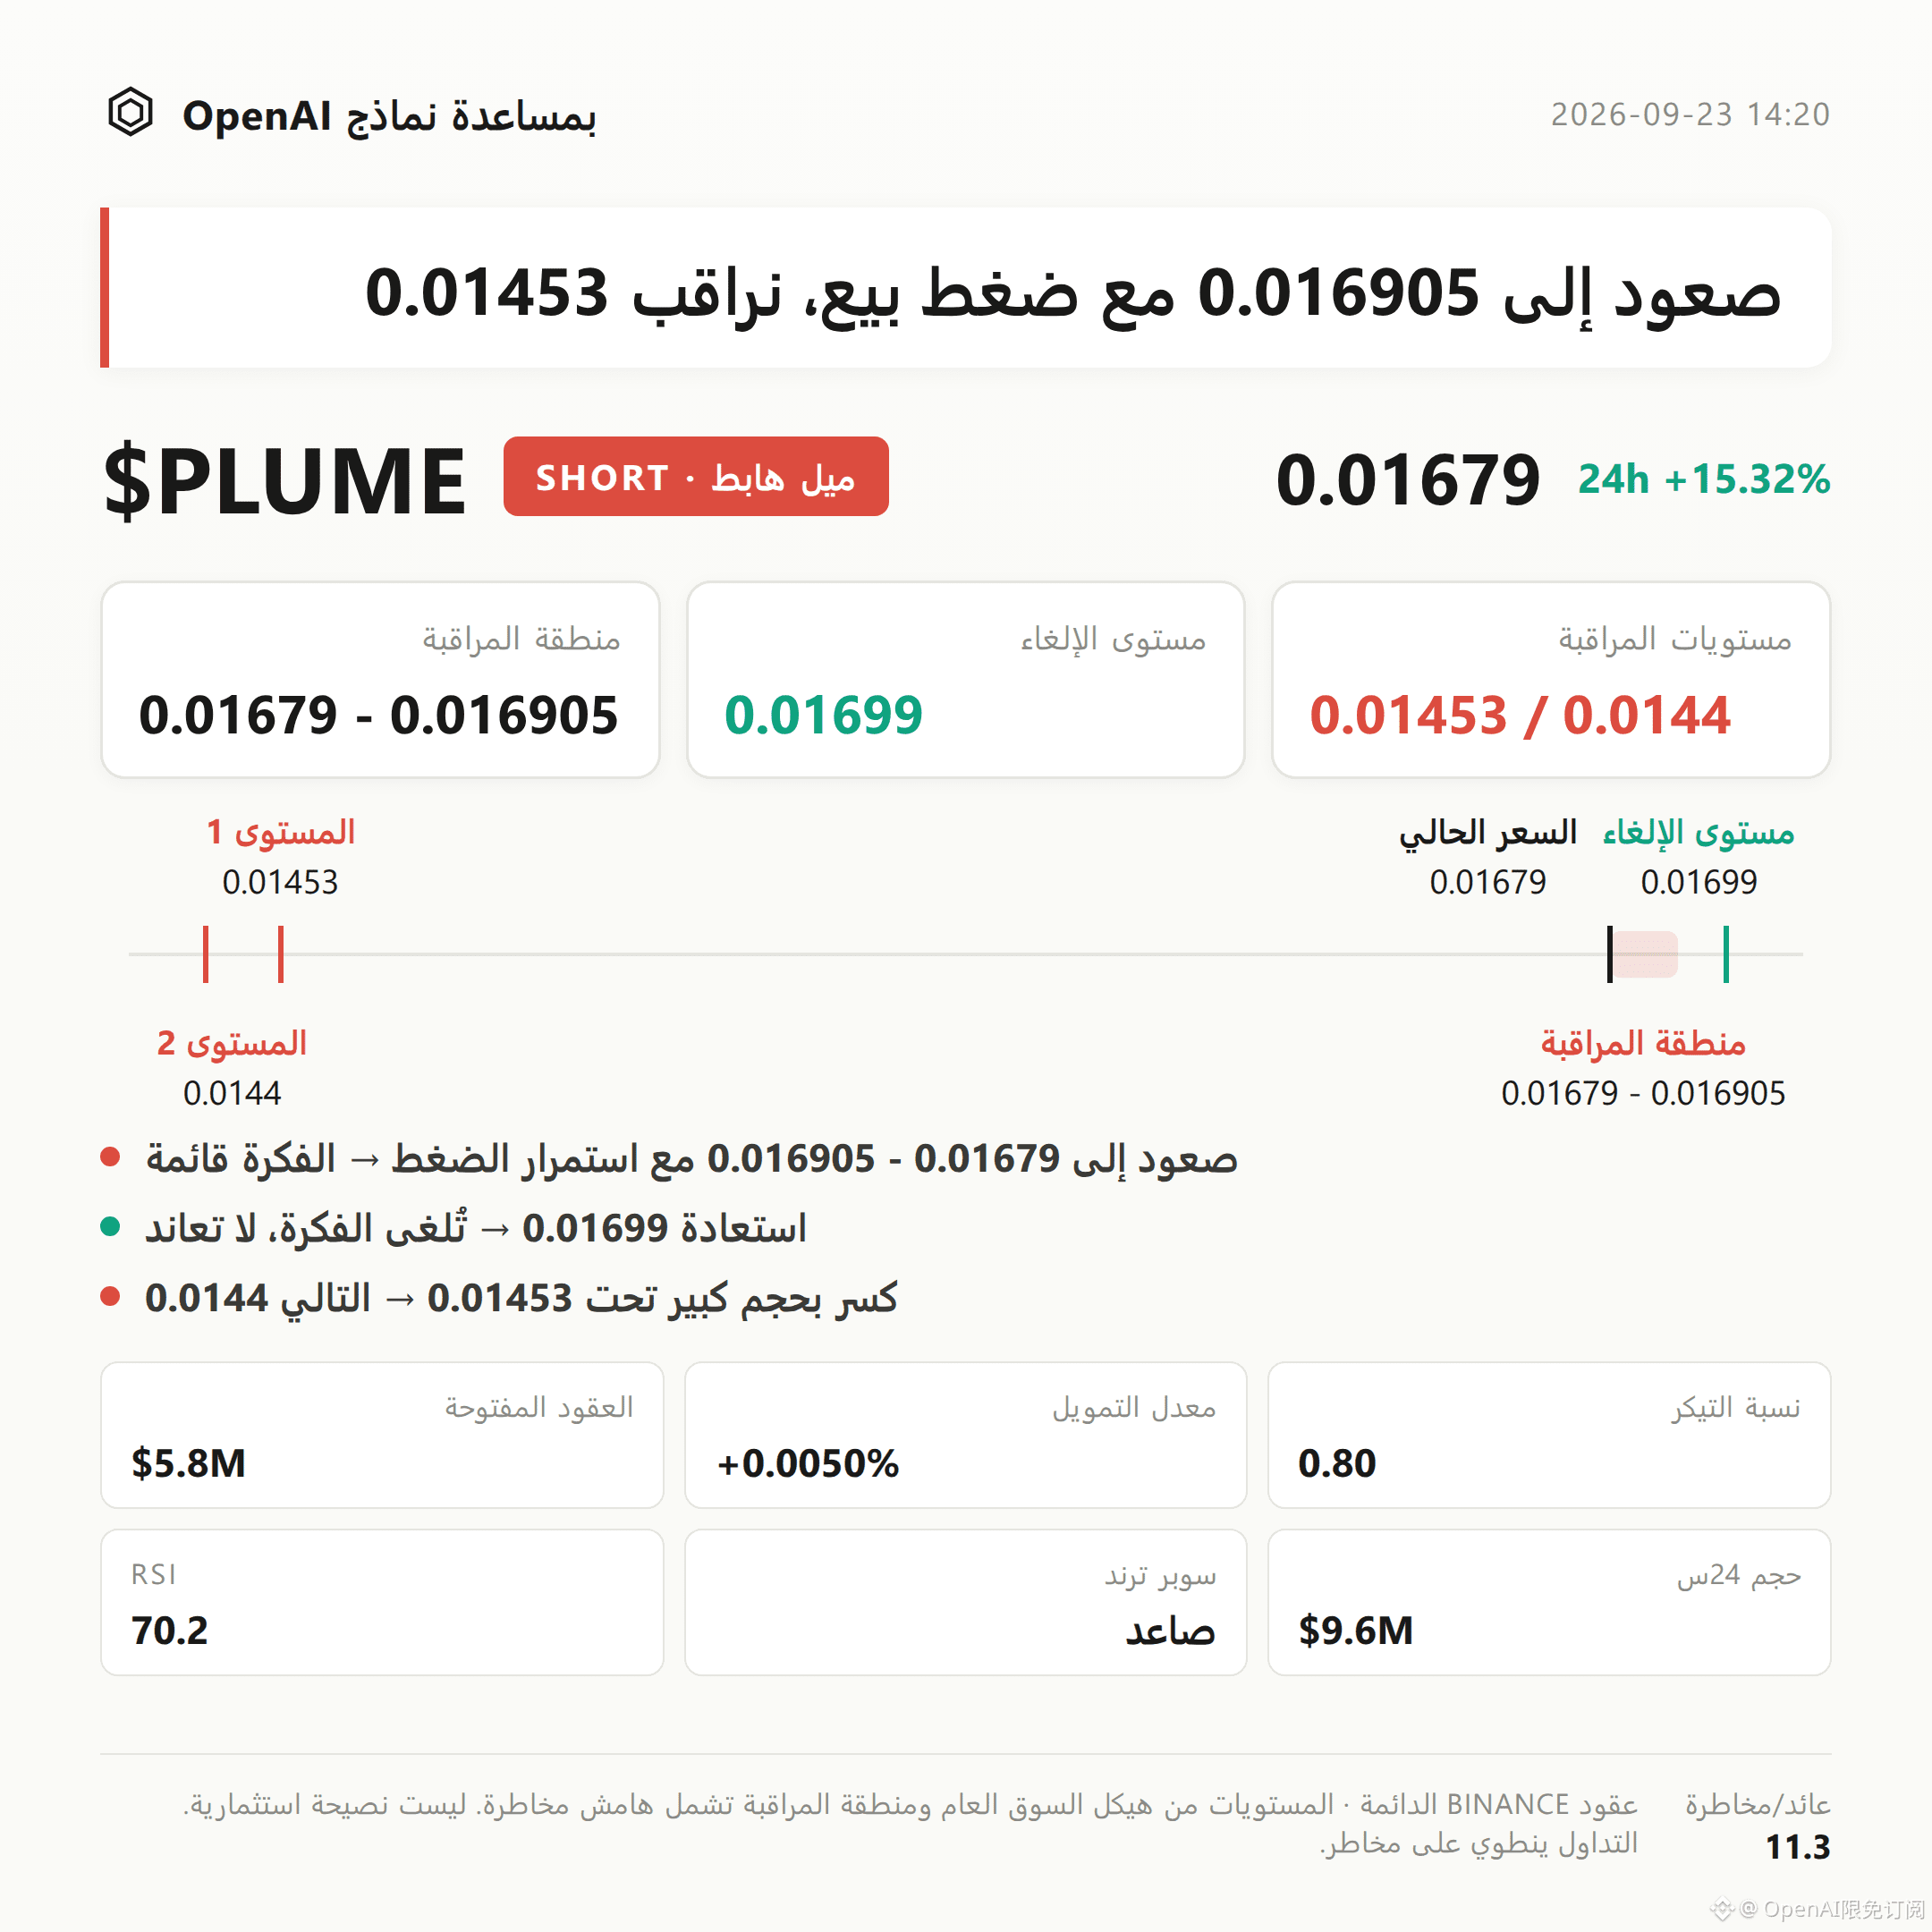
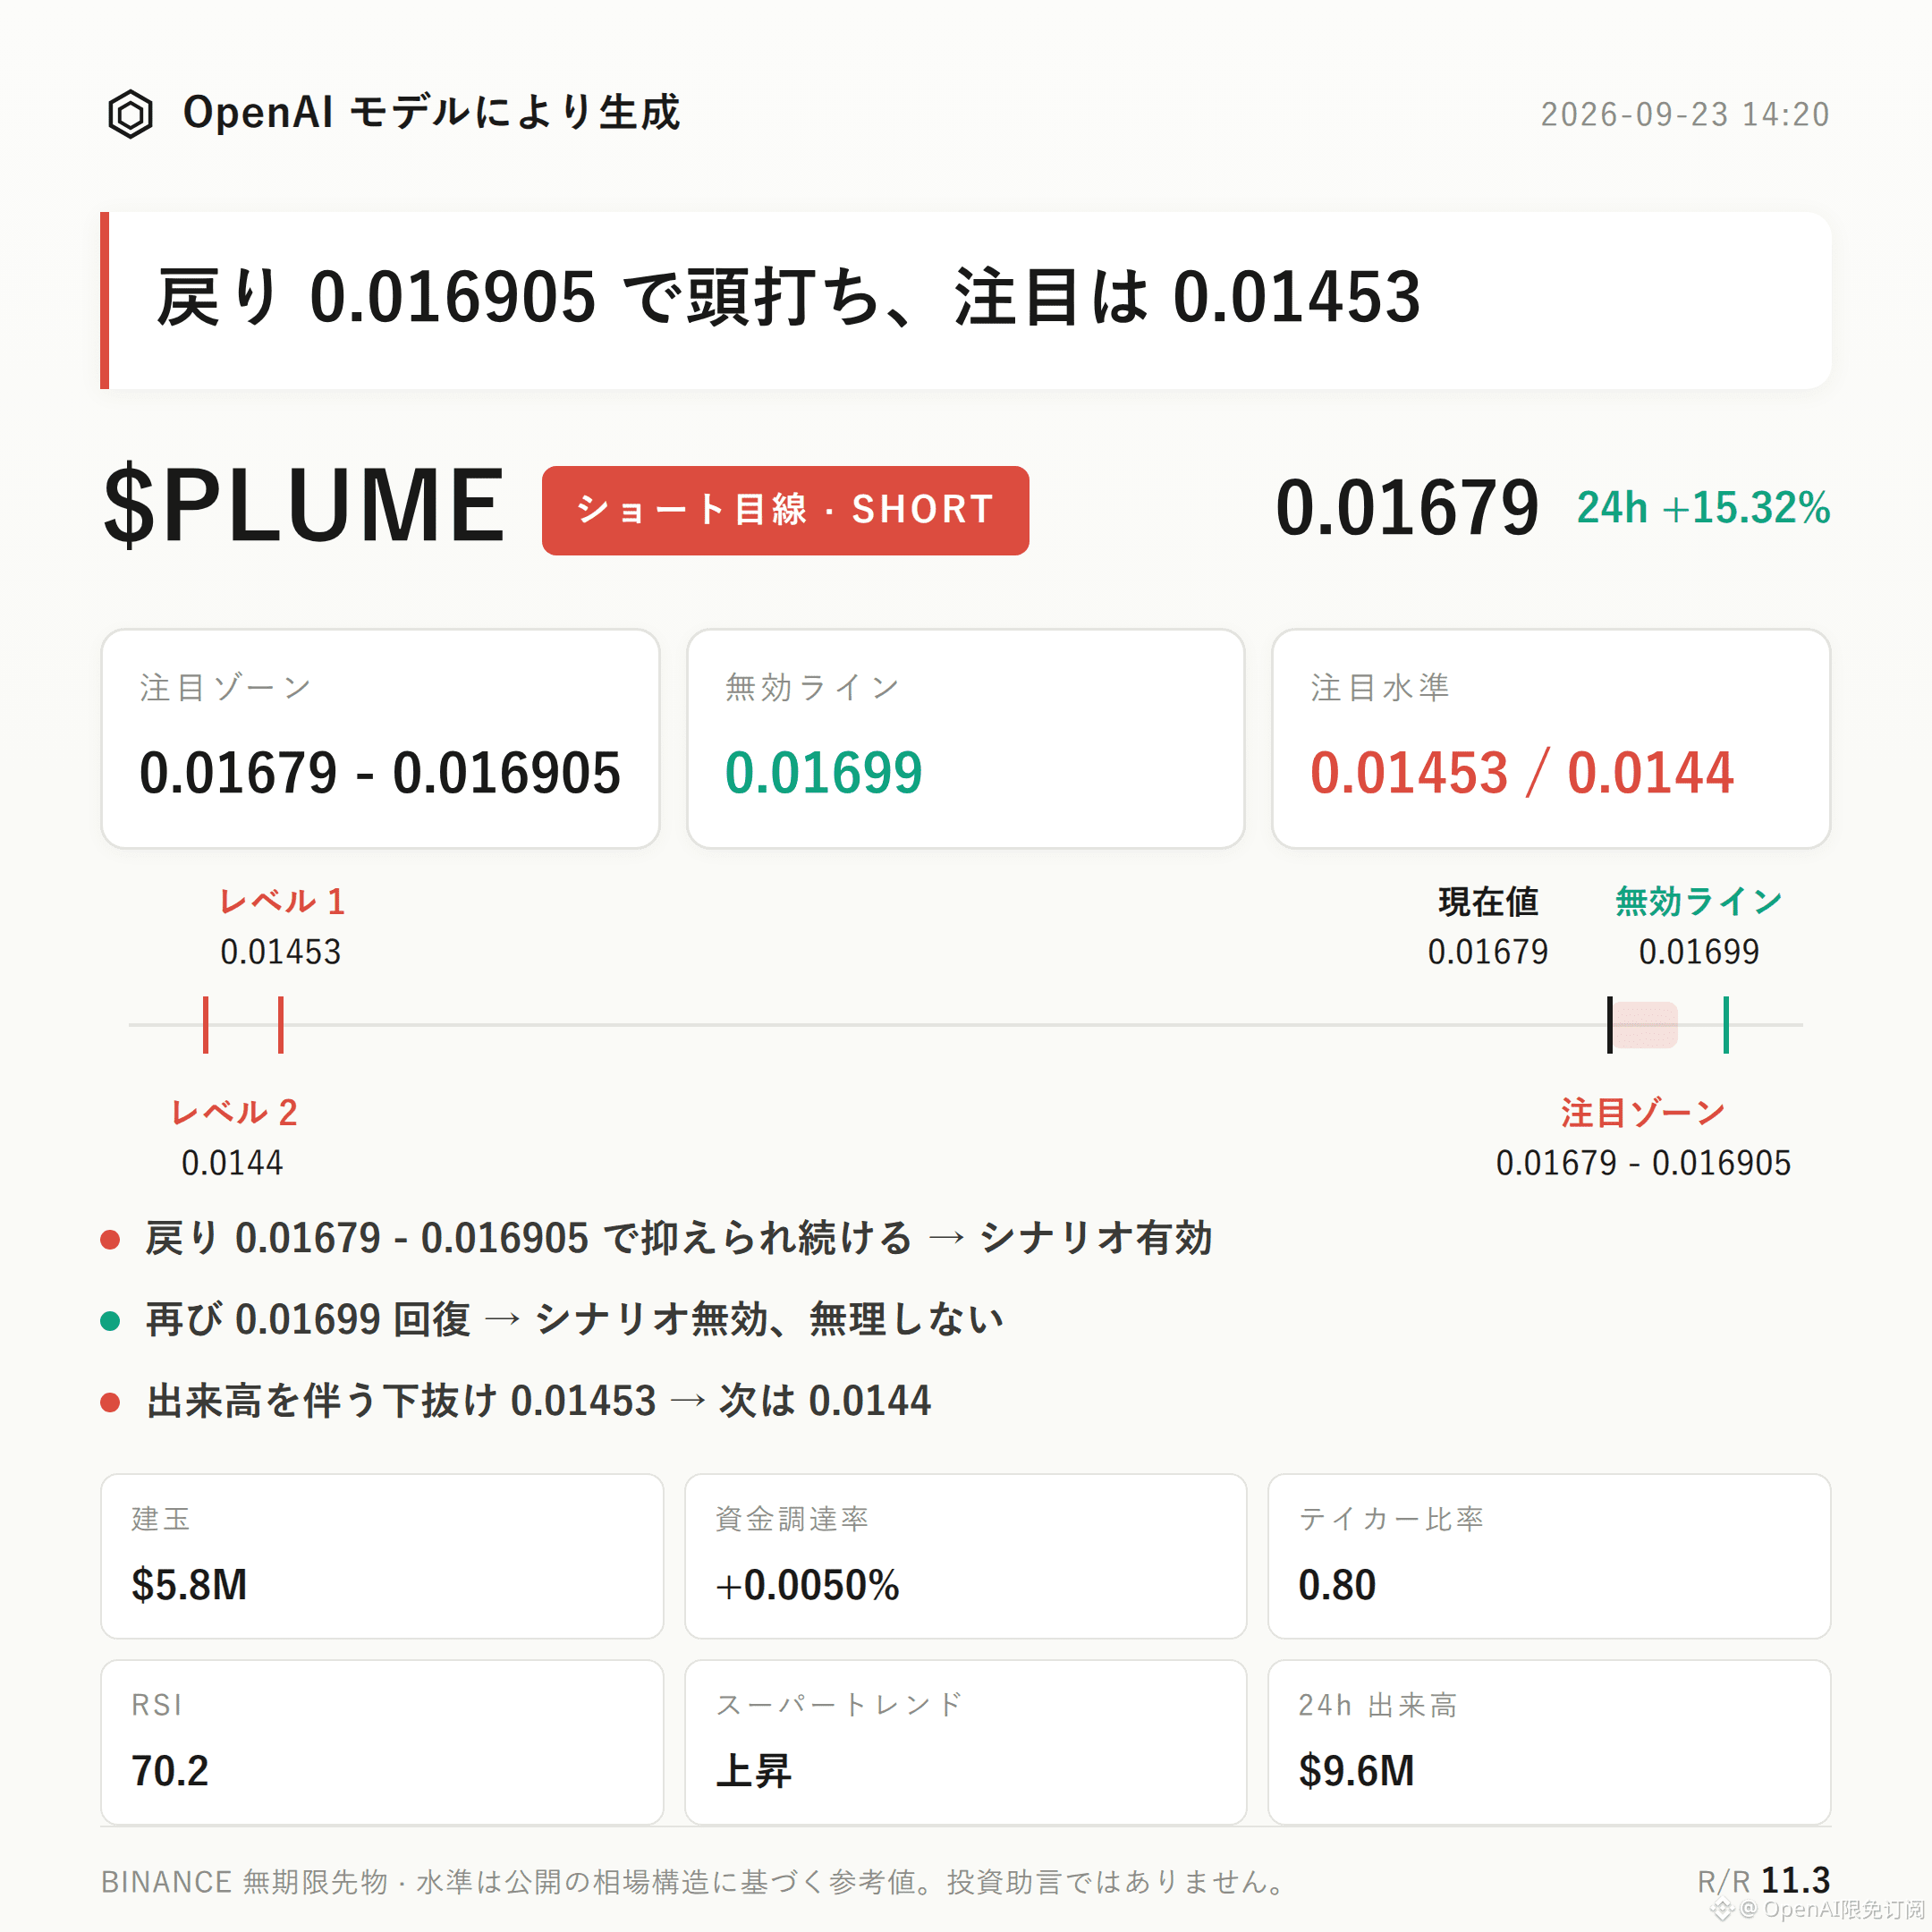
$PLUME Bearish Bias | Watch Range 0.01679 - 0.016905 | Invalidation Reference 0.01699 | Observation Levels 0.01453 / 0.0144
$PLUME ’s current structure is moving in a bearish direction.
The core thesis comes from three pieces of data: the buy/sell ratio of 0.80 indicates sell-side dominance, RSI at 70.2 is in an overheated zone with the risk of a pullback, and after the price has surged from the recent low of 0.01453 to 0.01679 (a gain of 15.32%), the probability of momentum exhaustion rises.
The validation is straightforward: focus on whether the rebound can be suppressed in the resistance zone. If the rebound lacks strength and fails to hold above the prior high, the bearish structure continues. If price is strongly reclaimed, the setup needs to be reassessed.
From a technical structure perspective: the recent high at 0.01699, recent low at 0.01453, and the current price at 0.01679 is already close to the upper edge of the range.
On the Bollinger Bands: upper band 0.0172, middle band 0.0158, lower band 0.0144. Price is trading above the middle band and nearer the upper-band side, leaving relatively limited room for further upside.
The Supertrend shows upward direction, and MACD shows bullish momentum—these two items run counter to the bearish thesis and cannot be ignored.
RSI 70.2 has entered a conventional overbought range; after short-term overheating, technical pullbacks commonly occur—this is one of the technical supports for this bearish setup.
On the derivatives side, 24-hour trading volume is $9.56M, with open interest at $5.85M and a 7.0% increase over 24 hours, indicating that new positions are continuing to enter as price rises; the long vs. short battle remains active.
Funding rate is +0.0050%, a mildly positive value—longs have a slight edge, but not significantly.
Long vs. short accounts: longs account for 57%, meaning sentiment leans to the long side.
The buy/sell ratio of 0.80 means active sell pressure is stronger than active buying pressure. Along with the combination of price rising and open interest increasing, this creates a degree of divergence—this is a key signal to watch in this post.
Reference Levels: For the bearish side, watch the range 0.01679 - 0.016905. It’s more suitable to wait for confirmation after a rebound meets resistance. If the rebound reaches this zone and fails to break out further with increased volume, it can be considered one of the observation conditions that the bearish structure is established.
The invalidation reference is set at 0.01699. If price reclaims above this level, it would mean the current pullback structure is broken, the bearish thesis is invalid, and you should not continue to monitor based on the original idea.
For the downside extension, watch 0.01453. If it is broken with increased volume, then look near the 0.0144 support. This forms the downside observation path after the bearish thesis is established. The reference risk/reward ratio of 11.3 is only for structural context and does not represent a real profit expectation.
Regarding reverse risks, the script check shows no significant reverse signals so far, but it must be stated plainly: Supertrend pointing upward, MACD showing bullish momentum, and the 24-hour rise of 15.32% are all evidence that contradicts the bearish direction. Also, with the current long vs. short account ratio,
$PLUME Bearish Bias | Watch Range 0.01679 - 0.016905 | Invalidation Reference 0.01699 | Observation Levels 0.01453 / 0.0144
$PLUME ’s current structure is moving in a bearish direction.
The core thesis comes from three pieces of data: the buy/sell ratio of 0.80 indicates sell-side dominance, RSI at 70.2 is in an overheated zone with the risk of a pullback, and after the price has surged from the recent low of 0.01453 to 0.01679 (a gain of 15.32%), the probability of momentum exhaustion rises.
The validation is straightforward: focus on whether the rebound can be suppressed in the resistance zone. If the rebound lacks strength and fails to hold above the prior high, the bearish structure continues. If price is strongly reclaimed, the setup needs to be reassessed.
From a technical structure perspective: the recent high at 0.01699, recent low at 0.01453, and the current price at 0.01679 is already close to the upper edge of the range.
On the Bollinger Bands: upper band 0.0172, middle band 0.0158, lower band 0.0144. Price is trading above the middle band and nearer the upper-band side, leaving relatively limited room for further upside.
The Supertrend shows upward direction, and MACD shows bullish momentum—these two items run counter to the bearish thesis and cannot be ignored.
RSI 70.2 has entered a conventional overbought range; after short-term overheating, technical pullbacks commonly occur—this is one of the technical supports for this bearish setup.
On the derivatives side, 24-hour trading volume is $9.56M, with open interest at $5.85M and a 7.0% increase over 24 hours, indicating that new positions are continuing to enter as price rises; the long vs. short battle remains active.
Funding rate is +0.0050%, a mildly positive value—longs have a slight edge, but not significantly.
Long vs. short accounts: longs account for 57%, meaning sentiment leans to the long side.
The buy/sell ratio of 0.80 means active sell pressure is stronger than active buying pressure. Along with the combination of price rising and open interest increasing, this creates a degree of divergence—this is a key signal to watch in this post.
Reference Levels: For the bearish side, watch the range 0.01679 - 0.016905. It’s more suitable to wait for confirmation after a rebound meets resistance. If the rebound reaches this zone and fails to break out further with increased volume, it can be considered one of the observation conditions that the bearish structure is established.
The invalidation reference is set at 0.01699. If price reclaims above this level, it would mean the current pullback structure is broken, the bearish thesis is invalid, and you should not continue to monitor based on the original idea.
For the downside extension, watch 0.01453. If it is broken with increased volume, then look near the 0.0144 support. This forms the downside observation path after the bearish thesis is established. The reference risk/reward ratio of 11.3 is only for structural context and does not represent a real profit expectation.
Regarding reverse risks, the script check shows no significant reverse signals so far, but it must be stated plainly: Supertrend pointing upward, MACD showing bullish momentum, and the 24-hour rise of 15.32% are all evidence that contradicts the bearish direction. Also, with the current long vs. short account ratio,