$BTC $NVDAX $BTC
NVDA is testing the highs — but this is where confirmation matters.
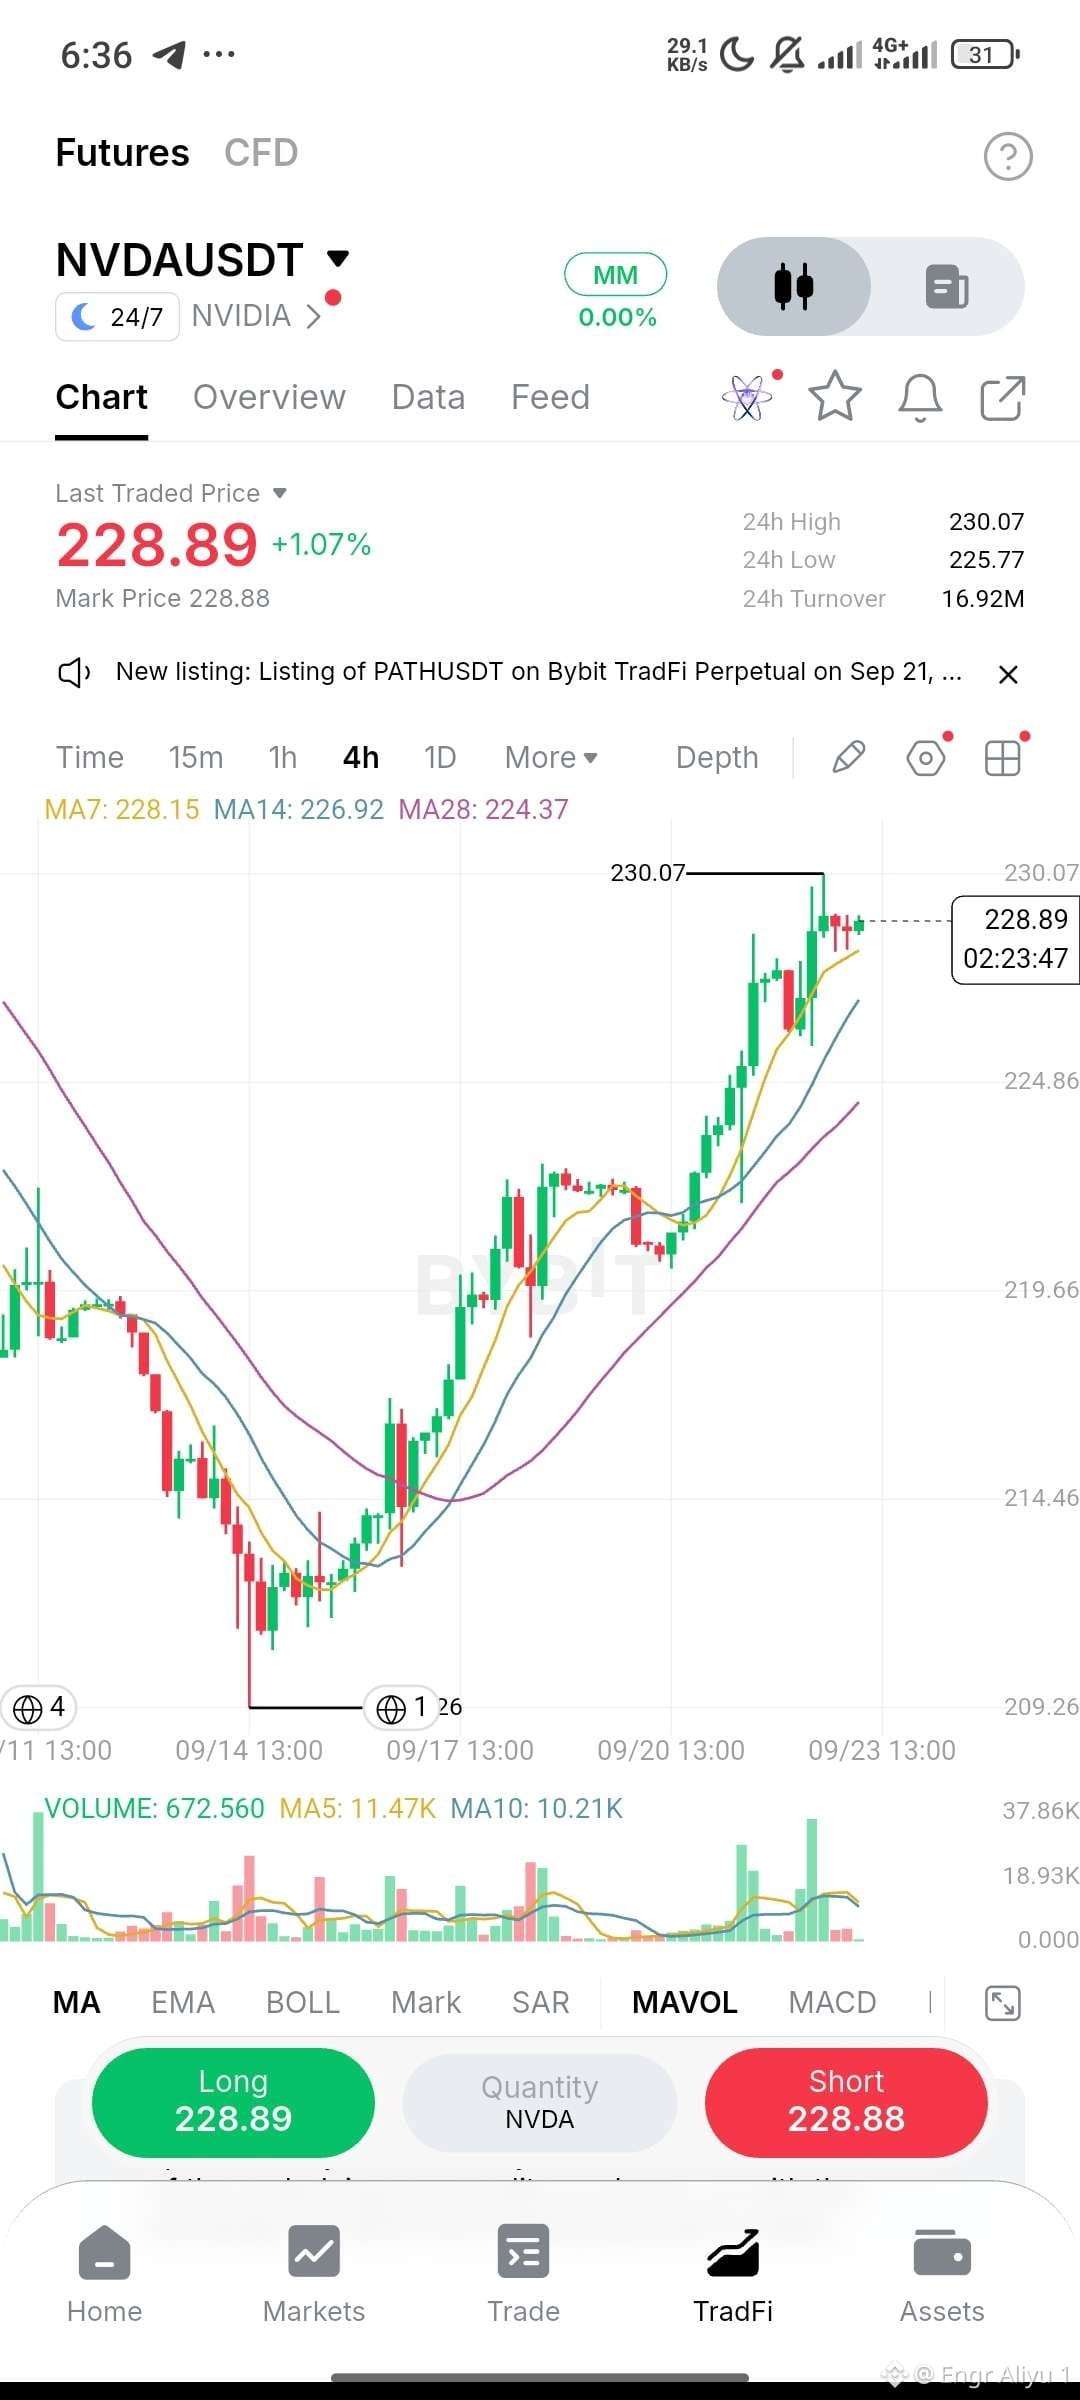
On the 4H chart, the structure is clearly bullish:
→ Price: $228.89
→ MA7: $228.15
→ MA14: $226.92
→ MA28: $224.37
All three moving averages are stacked upward, showing strong momentum.
But NVDA is now sitting just below the $230 resistance area after a sharp move higher.
The interesting part?
Volume expanded during the breakout, suggesting the move had participation behind it. Now the market needs to prove whether $230 becomes a breakout level or another rejection zone.
The setup I’m watching:
Break and hold above $230 → continuation becomes more interesting.
Rejection around $230 → watch $226–227 for the first meaningful pullback area.
Sometimes the best trade isn't chasing the green candles.
It’s waiting for price to confirm what the trend is already suggesting.
#BTC Price Analysis# #Macro Insights#
NVDA is testing the highs — but this is where confirmation matters.
On the 4H chart, the structure is clearly bullish:
→ Price: $228.89
→ MA7: $228.15
→ MA14: $226.92
→ MA28: $224.37
All three moving averages are stacked upward, showing strong momentum.
But NVDA is now sitting just below the $230 resistance area after a sharp move higher.
The interesting part?
Volume expanded during the breakout, suggesting the move had participation behind it. Now the market needs to prove whether $230 becomes a breakout level or another rejection zone.
The setup I’m watching:
Break and hold above $230 → continuation becomes more interesting.
Rejection around $230 → watch $226–227 for the first meaningful pullback area.
Sometimes the best trade isn't chasing the green candles.
It’s waiting for price to confirm what the trend is already suggesting.
#BTC Price Analysis# #Macro Insights#