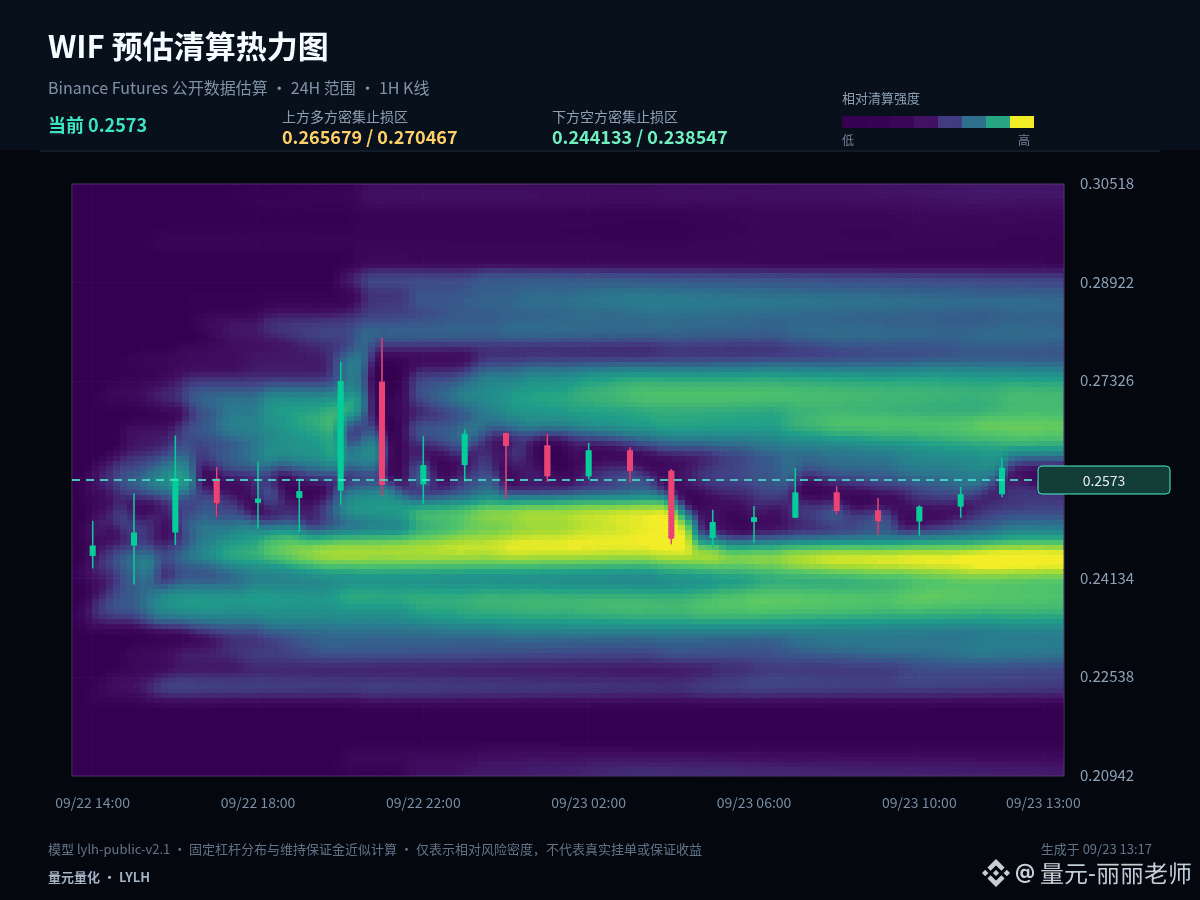
$WIF #WIF It currently looks more like range trading and rotation—there’s no need to interpret every 1-hour candlestick as a new trend. Current price: 0.2573, 1 hour: -0.89%, 24 hours: +7.52%.
In terms of cycle alignment, 24 hours remains +7.52%, while the 1-hour timeframe has pulled back to -0.89%—more like a cooldown within an uptrend structure. If the retracement doesn’t break key support, it’s normal rotation; if support is lost and the rebound lacks strength, short-term control shifts from the bulls to the bears.
On the range: upper boundary 0.2801, lower boundary 0.241, midline 0.26055. Near the upper boundary, look for breakout quality; near the lower boundary, watch for follow-through/acceptance. Around the midline, reduce frequent trading, because it’s not far enough from either side—direction and risk-reward aren’t clear.
The signals truly worth acting on are: after a breakout, price is willing to stay in the new range; or after a dip to the boundary, it quickly snaps back into the range. Without such confirmation, keep treating it as range-bound, and don’t let brief intraday fluctuations change the overall plan.
For those who already hold positions, the focus should be on whether support remains valid—not on getting carried away by every fluctuation. For those with no position, prioritize waiting for a breakout pullback or support confirmation. For spot holdings, you can scale in batches; for futures, shorten the decision chain—first determine the stop-loss level, then decide whether to participate.
Risk control still comes before the conclusion: execute only when conditions are met, and reevaluate promptly if price invalidates the setup. The larger the volatility, the more restraint you must show with each single position. The above is a scenario projection based on the current 1-hour and 24-hour data, and it does not constitute any promise of returns.
#BNBMarketCapPassesBNYMellon
In terms of cycle alignment, 24 hours remains +7.52%, while the 1-hour timeframe has pulled back to -0.89%—more like a cooldown within an uptrend structure. If the retracement doesn’t break key support, it’s normal rotation; if support is lost and the rebound lacks strength, short-term control shifts from the bulls to the bears.
On the range: upper boundary 0.2801, lower boundary 0.241, midline 0.26055. Near the upper boundary, look for breakout quality; near the lower boundary, watch for follow-through/acceptance. Around the midline, reduce frequent trading, because it’s not far enough from either side—direction and risk-reward aren’t clear.
The signals truly worth acting on are: after a breakout, price is willing to stay in the new range; or after a dip to the boundary, it quickly snaps back into the range. Without such confirmation, keep treating it as range-bound, and don’t let brief intraday fluctuations change the overall plan.
For those who already hold positions, the focus should be on whether support remains valid—not on getting carried away by every fluctuation. For those with no position, prioritize waiting for a breakout pullback or support confirmation. For spot holdings, you can scale in batches; for futures, shorten the decision chain—first determine the stop-loss level, then decide whether to participate.
Risk control still comes before the conclusion: execute only when conditions are met, and reevaluate promptly if price invalidates the setup. The larger the volatility, the more restraint you must show with each single position. The above is a scenario projection based on the current 1-hour and 24-hour data, and it does not constitute any promise of returns.
#BNBMarketCapPassesBNYMellon