🚀 Ethereum breaks resistance: soaring toward new highs! ⚡
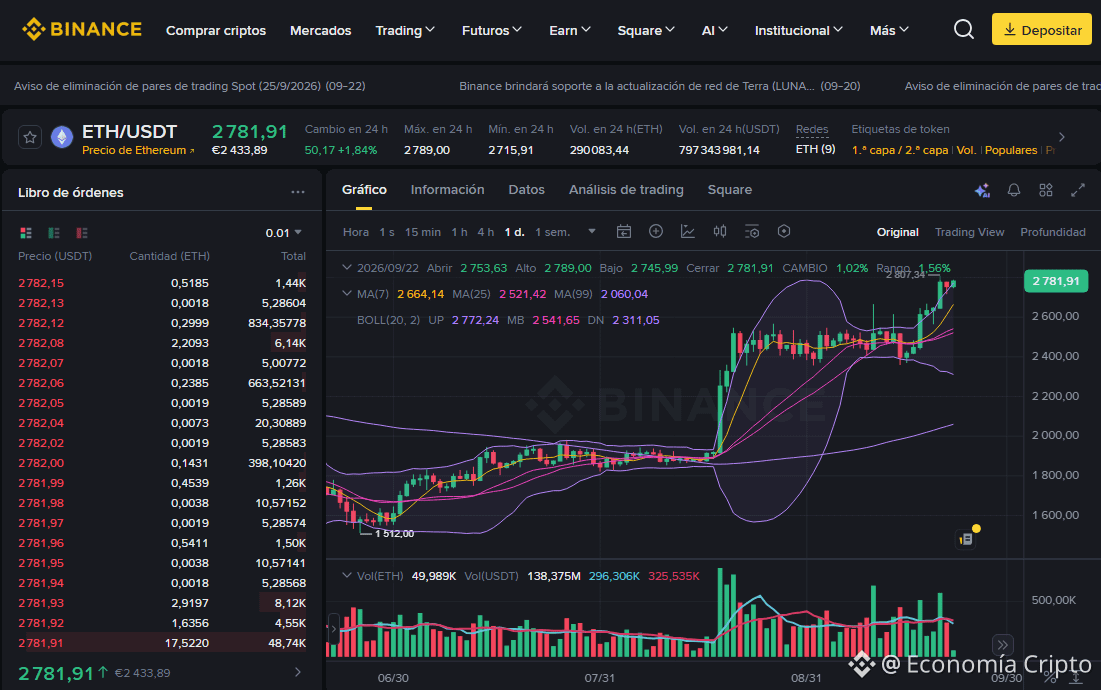
The ETH/USDT pair is trading at 2,781.91, recording a +1.84% gain over the last 24 hours. The daily session shows an opening at 2,753.63, a high of 2,789.00, a low of 2,745.99, and a current level of 2,781.91 (+1.02% in the daily variation), reflecting strong buying pressure in the market.
🔍 Trend Analysis and Indicators
Trend: Strong, dominant bullish trend, with a clear structure of higher highs and higher lows in the short and medium term.
Moving Averages: The price is comfortably above the MA(7) (2,664.14) and the MA(25) (2,521.42), while the broader macro trend is firmly confirmed by trading well above the MA(99) (2,060.04).
Bollinger Bands: Price is pressing and slightly breaking above the upper band UP (2,772.24) from the middle band MB (2,541.65) (with the lower band DN (2,311.05)), indicating a notable expansion of bullish volatility.
Key Levels: Immediate support is consolidating in the 2,715 - 2,745 area, while the main resistance to overcome is located at the session high of 2,789.00.
💡 Trading Strategy: Buy or Sell?
Buy (Long)?: The strong trend supports bullish continuation, prioritizing tactical entries on minor pullbacks toward support zones and managing risk with an adjusted Stop Loss.
Sell (Short)?: Going short carries high risk due to the robustness of the current trend; it would only be considered if there were a clear and sustained loss of the fast moving averages.
#Ethereum #AnalisisTecnico #CryptoTrading
May the Lord bless and prosper those who trade here, in the name of Jesus, because your word says: "Mine is the silver, and mine is the gold," says the LORD of hosts. Hageo 2:8 RV1960-T -
$ETH
The ETH/USDT pair is trading at 2,781.91, recording a +1.84% gain over the last 24 hours. The daily session shows an opening at 2,753.63, a high of 2,789.00, a low of 2,745.99, and a current level of 2,781.91 (+1.02% in the daily variation), reflecting strong buying pressure in the market.
🔍 Trend Analysis and Indicators
Trend: Strong, dominant bullish trend, with a clear structure of higher highs and higher lows in the short and medium term.
Moving Averages: The price is comfortably above the MA(7) (2,664.14) and the MA(25) (2,521.42), while the broader macro trend is firmly confirmed by trading well above the MA(99) (2,060.04).
Bollinger Bands: Price is pressing and slightly breaking above the upper band UP (2,772.24) from the middle band MB (2,541.65) (with the lower band DN (2,311.05)), indicating a notable expansion of bullish volatility.
Key Levels: Immediate support is consolidating in the 2,715 - 2,745 area, while the main resistance to overcome is located at the session high of 2,789.00.
💡 Trading Strategy: Buy or Sell?
Buy (Long)?: The strong trend supports bullish continuation, prioritizing tactical entries on minor pullbacks toward support zones and managing risk with an adjusted Stop Loss.
Sell (Short)?: Going short carries high risk due to the robustness of the current trend; it would only be considered if there were a clear and sustained loss of the fast moving averages.
#Ethereum #AnalisisTecnico #CryptoTrading
May the Lord bless and prosper those who trade here, in the name of Jesus, because your word says: "Mine is the silver, and mine is the gold," says the LORD of hosts. Hageo 2:8 RV1960-T -
$ETH