$BTC What’s the market outlook from here? ???
Only based on a technical analysis of the current price action:
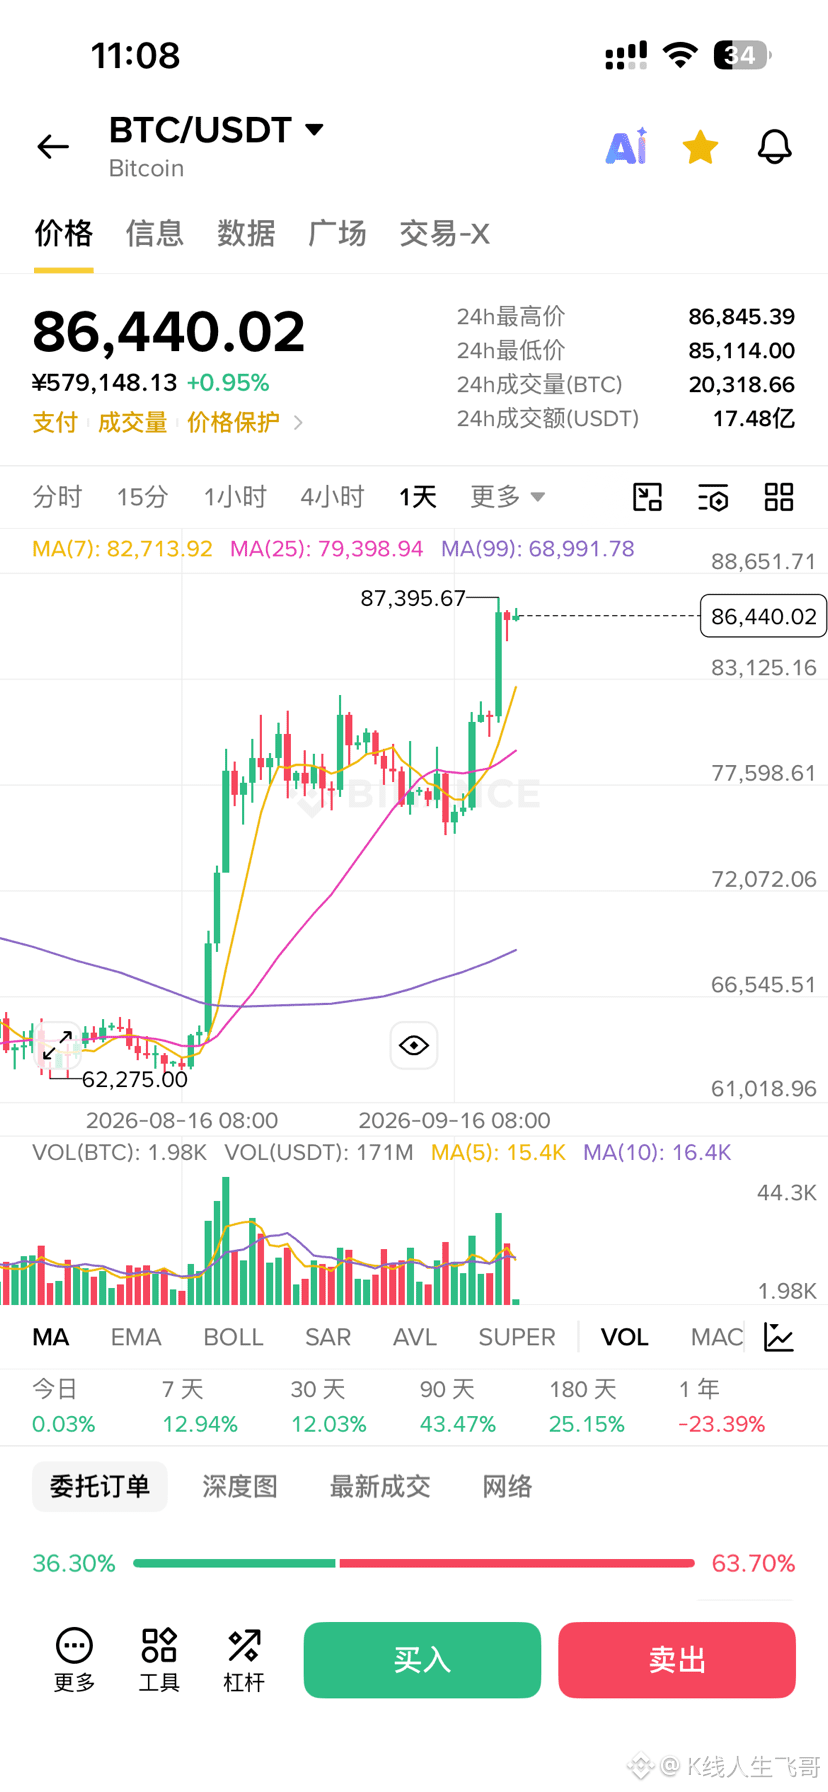
From the daily chart: after BTC’s lowest pullback to around 85,000, it continued to rise. The daily candle formed a small bearish candle with a doji. The key point is that yesterday’s pullback did not break below the crucial level of 84,500. Instead, it found support above. From a technical perspective, this looks like a normal correction after a strong rally.
From the weekly chart: BTC has already broken above the MA120 moving average, and it has also stabilized above the weekly-level resistance/support area at 82,800. This is a key level—the high point from the previous weekly-level rebound. During this period, price has repeatedly been pushed down at this level. After the 6th attempt, it successfully broke through and held. This suggests that the market structure is further shifting from a decline and consolidation into an up move of wave B. The first wave A rally was from 65,000 to 76,000, so technically the short-term trend still leans bullish.
Next, focus on the previous high at 87,358. Watch whether it can break through this level with the sideways movement over the next few days. If it can’t, then a pullback is likely.
For the short term: the plan is to buy on pullbacks. Look for buy-side support around 85,000. As long as the pullback is limited and the structure isn’t broken, we can continue to look for new highs. If there’s a rally that turns into a drop and BTC breaks below 85,000, then to guard against a wick/push-in (a false break) and to confirm the effective breakdown, we should place risk control at 84,500. That means you can’t mindlessly go long in the short term. So for our trades—whether for futures or spot—the approach is simple: keep moving the stop-loss line upward. If half the position breaks down, you should partially exit to protect profits.
Only based on a technical analysis of the current price action:
From the daily chart: after BTC’s lowest pullback to around 85,000, it continued to rise. The daily candle formed a small bearish candle with a doji. The key point is that yesterday’s pullback did not break below the crucial level of 84,500. Instead, it found support above. From a technical perspective, this looks like a normal correction after a strong rally.
From the weekly chart: BTC has already broken above the MA120 moving average, and it has also stabilized above the weekly-level resistance/support area at 82,800. This is a key level—the high point from the previous weekly-level rebound. During this period, price has repeatedly been pushed down at this level. After the 6th attempt, it successfully broke through and held. This suggests that the market structure is further shifting from a decline and consolidation into an up move of wave B. The first wave A rally was from 65,000 to 76,000, so technically the short-term trend still leans bullish.
Next, focus on the previous high at 87,358. Watch whether it can break through this level with the sideways movement over the next few days. If it can’t, then a pullback is likely.
For the short term: the plan is to buy on pullbacks. Look for buy-side support around 85,000. As long as the pullback is limited and the structure isn’t broken, we can continue to look for new highs. If there’s a rally that turns into a drop and BTC breaks below 85,000, then to guard against a wick/push-in (a false break) and to confirm the effective breakdown, we should place risk control at 84,500. That means you can’t mindlessly go long in the short term. So for our trades—whether for futures or spot—the approach is simple: keep moving the stop-loss line upward. If half the position breaks down, you should partially exit to protect profits.