IOST Coin Movement Analysis IOST$IOST
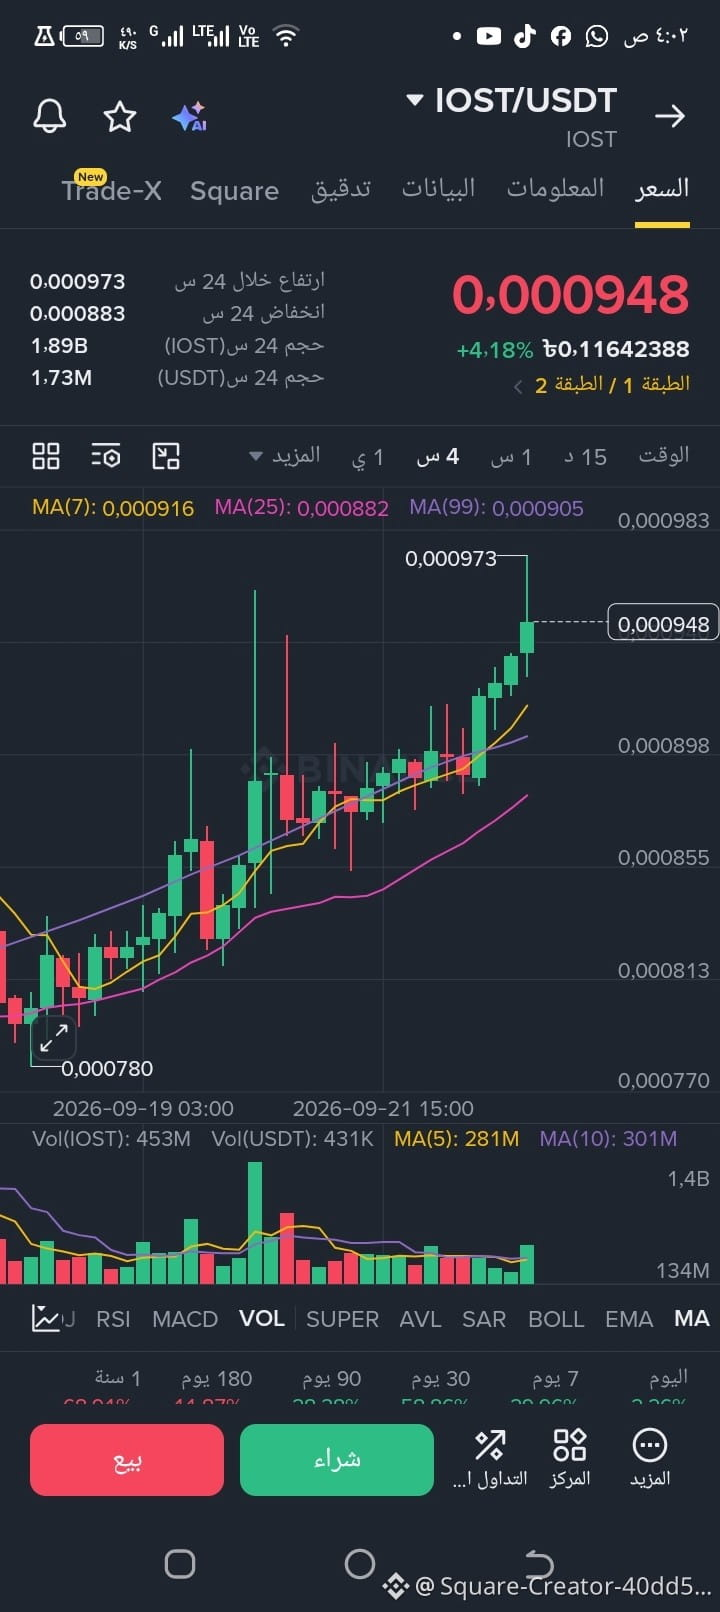
$/USDT Today – Exclusive and Fast Trend Update! 🚀Hello, trading beasts and dear followers! Let’s take a quick look today at the IOST coin chart against USDT, which is showing a noticeably positive move and excellent upward momentum that has drawn attention. Here’s the technical scene broken down with numbers and simplified technical analysis: 📊 Current figures on the chart:Current price: 0.000948 (with an excellent rise of +4.18%).Highest price in 24 hours: 0.000973 USDT.Lowest price in 24 hours: 0.000883 USDT.Trading volume (IOST): 1.89B – very strong liquidity and trading volume that supports the current surge. 🔍 Quick technical read (chart tactic):Japanese candles: We notice a consecutive series of green candles showing clear control by the bulls (buyers) and an attempt to break through nearby resistance levels.Moving averages: The current price is trading above the upward moving average on the short-term timeframe, acting as a strong support. Levels to watch: If the price manages to hold above the 0.000950 level, it will directly move to test the daily peak at 0.000973, and if it breaks through, we may see acceleration toward new higher levels! ⚠️ Disclaimer/Note: : Have you entered the current $IOST uptrend wave? What are your next targets for the coin? 👇🔥#IOST #Binance #تداول_العملات_الرقمية #تحليل_فني #CryptoYemen #USDT
$/USDT Today – Exclusive and Fast Trend Update! 🚀Hello, trading beasts and dear followers! Let’s take a quick look today at the IOST coin chart against USDT, which is showing a noticeably positive move and excellent upward momentum that has drawn attention. Here’s the technical scene broken down with numbers and simplified technical analysis: 📊 Current figures on the chart:Current price: 0.000948 (with an excellent rise of +4.18%).Highest price in 24 hours: 0.000973 USDT.Lowest price in 24 hours: 0.000883 USDT.Trading volume (IOST): 1.89B – very strong liquidity and trading volume that supports the current surge. 🔍 Quick technical read (chart tactic):Japanese candles: We notice a consecutive series of green candles showing clear control by the bulls (buyers) and an attempt to break through nearby resistance levels.Moving averages: The current price is trading above the upward moving average on the short-term timeframe, acting as a strong support. Levels to watch: If the price manages to hold above the 0.000950 level, it will directly move to test the daily peak at 0.000973, and if it breaks through, we may see acceleration toward new higher levels! ⚠️ Disclaimer/Note: : Have you entered the current $IOST uptrend wave? What are your next targets for the coin? 👇🔥#IOST #Binance #تداول_العملات_الرقمية #تحليل_فني #CryptoYemen #USDT