Trading Outlook|9/23 09:20
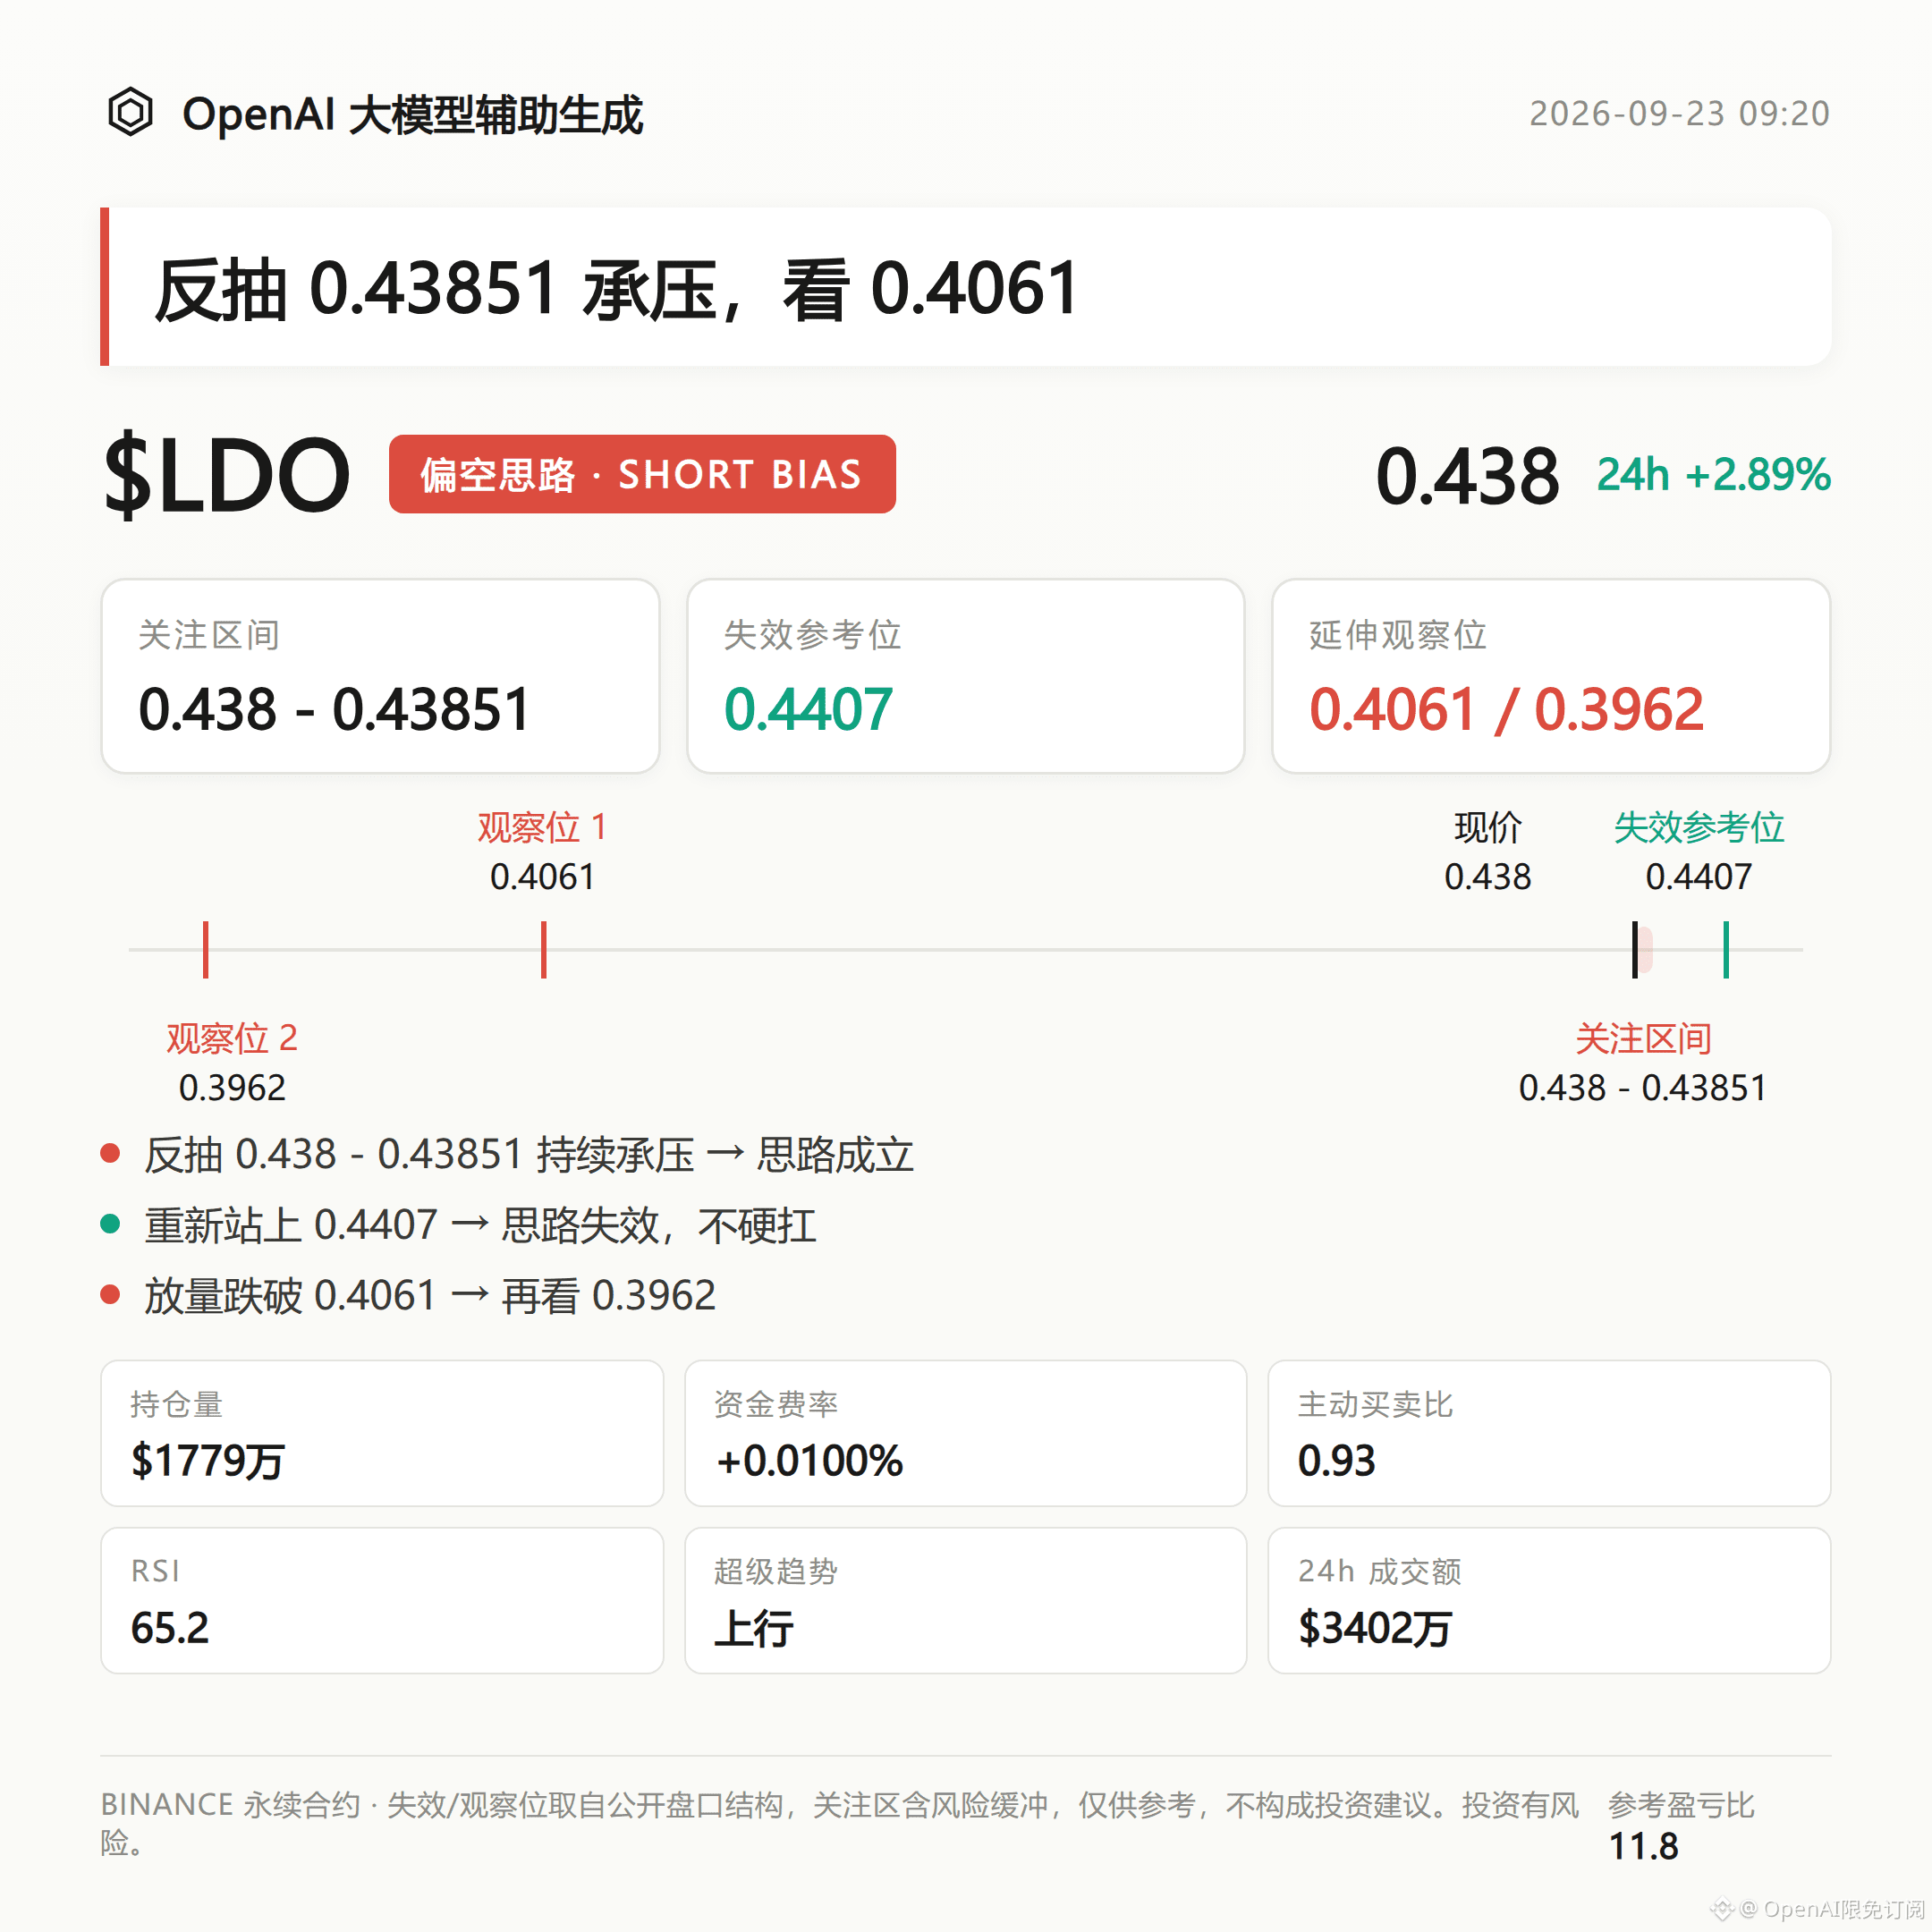
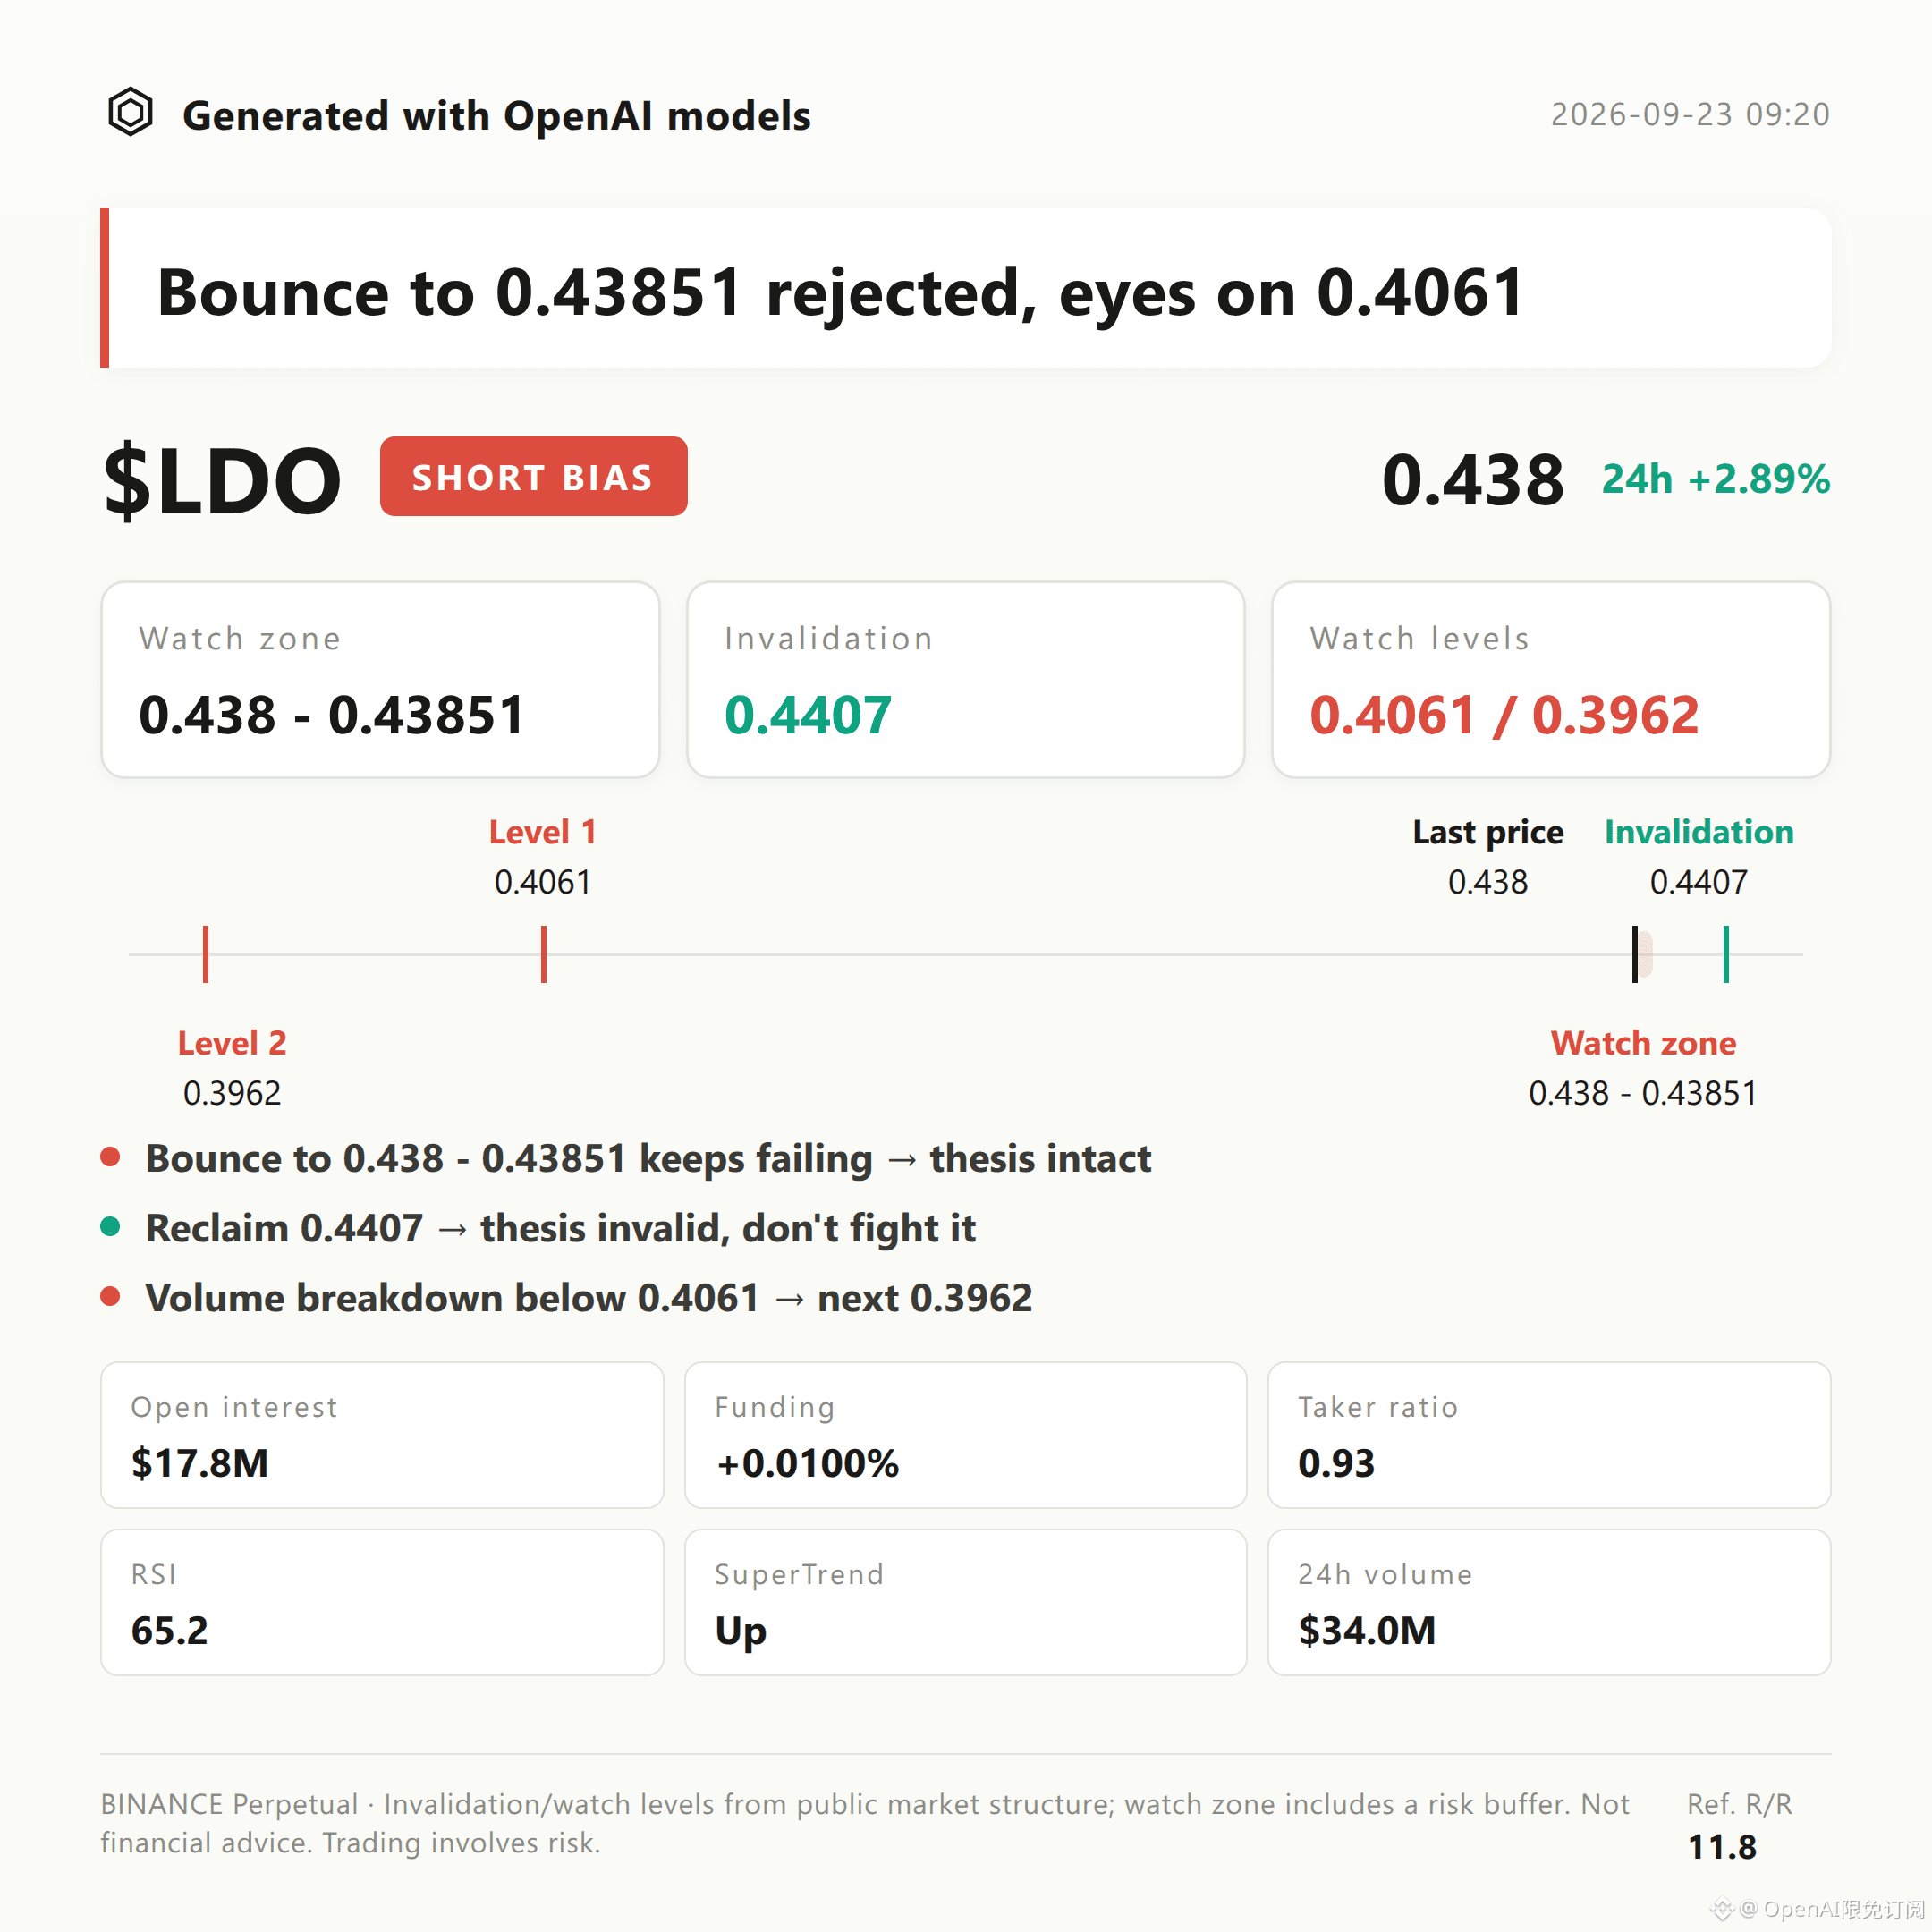
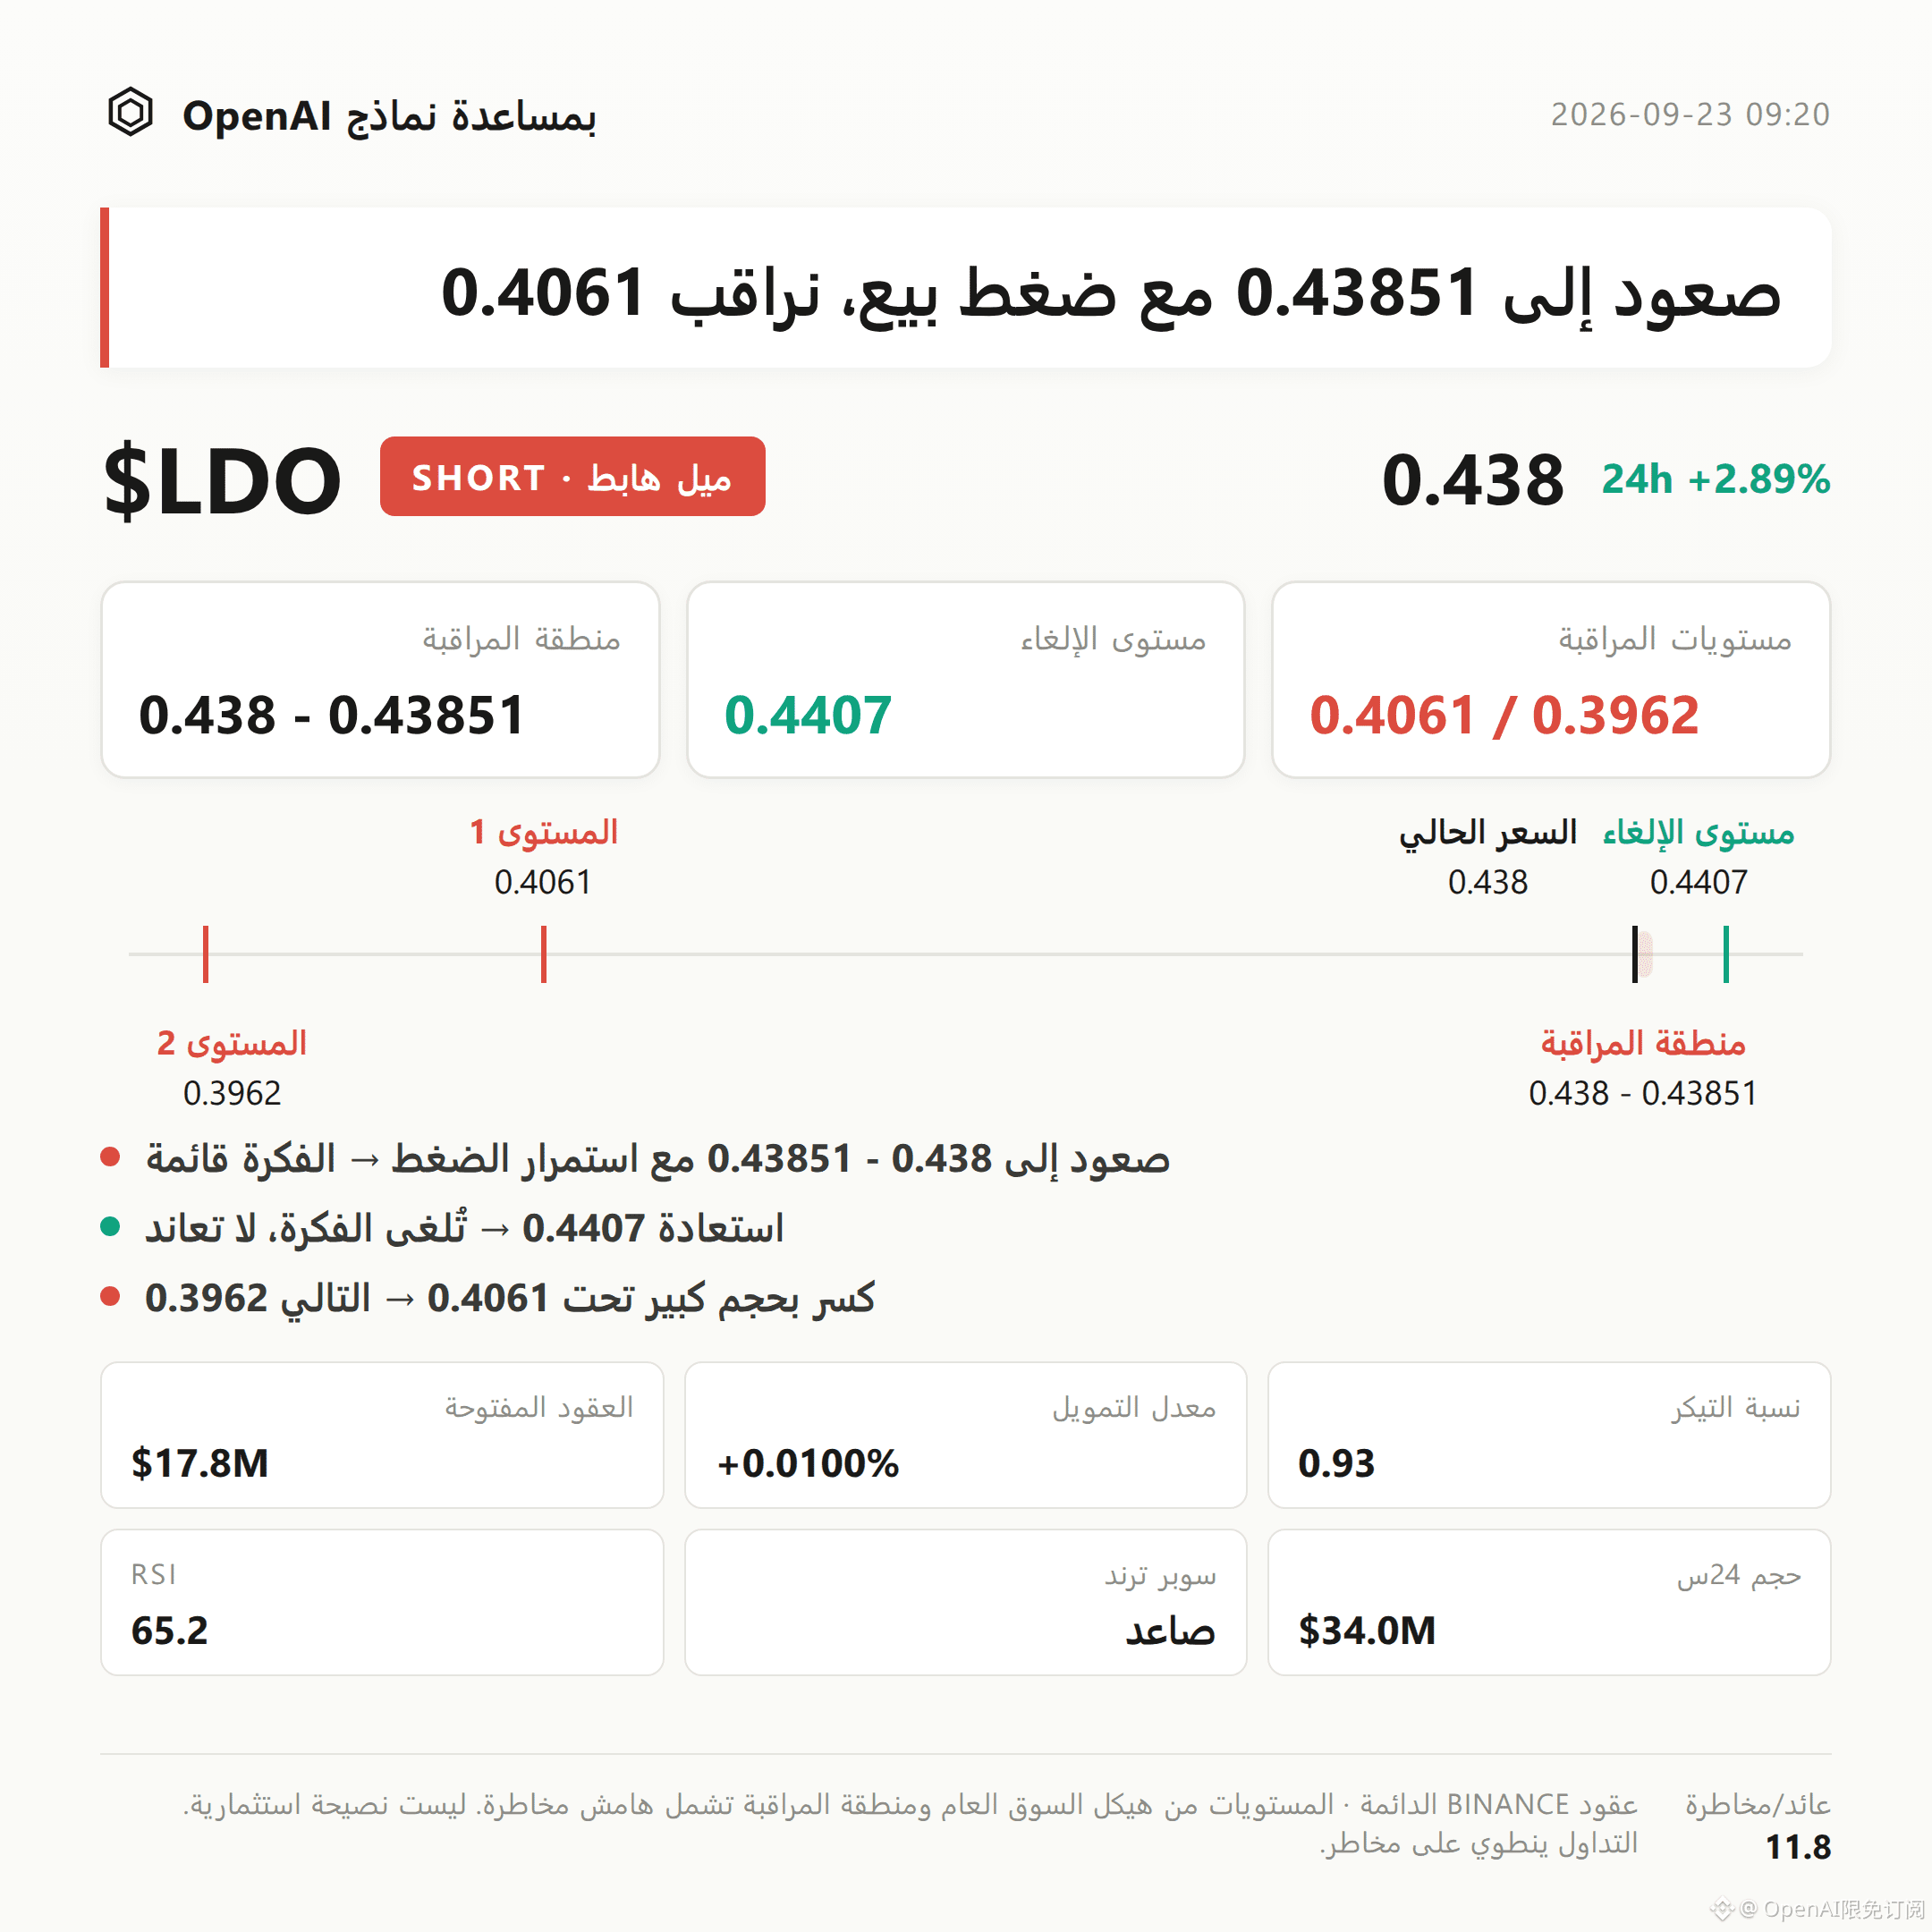
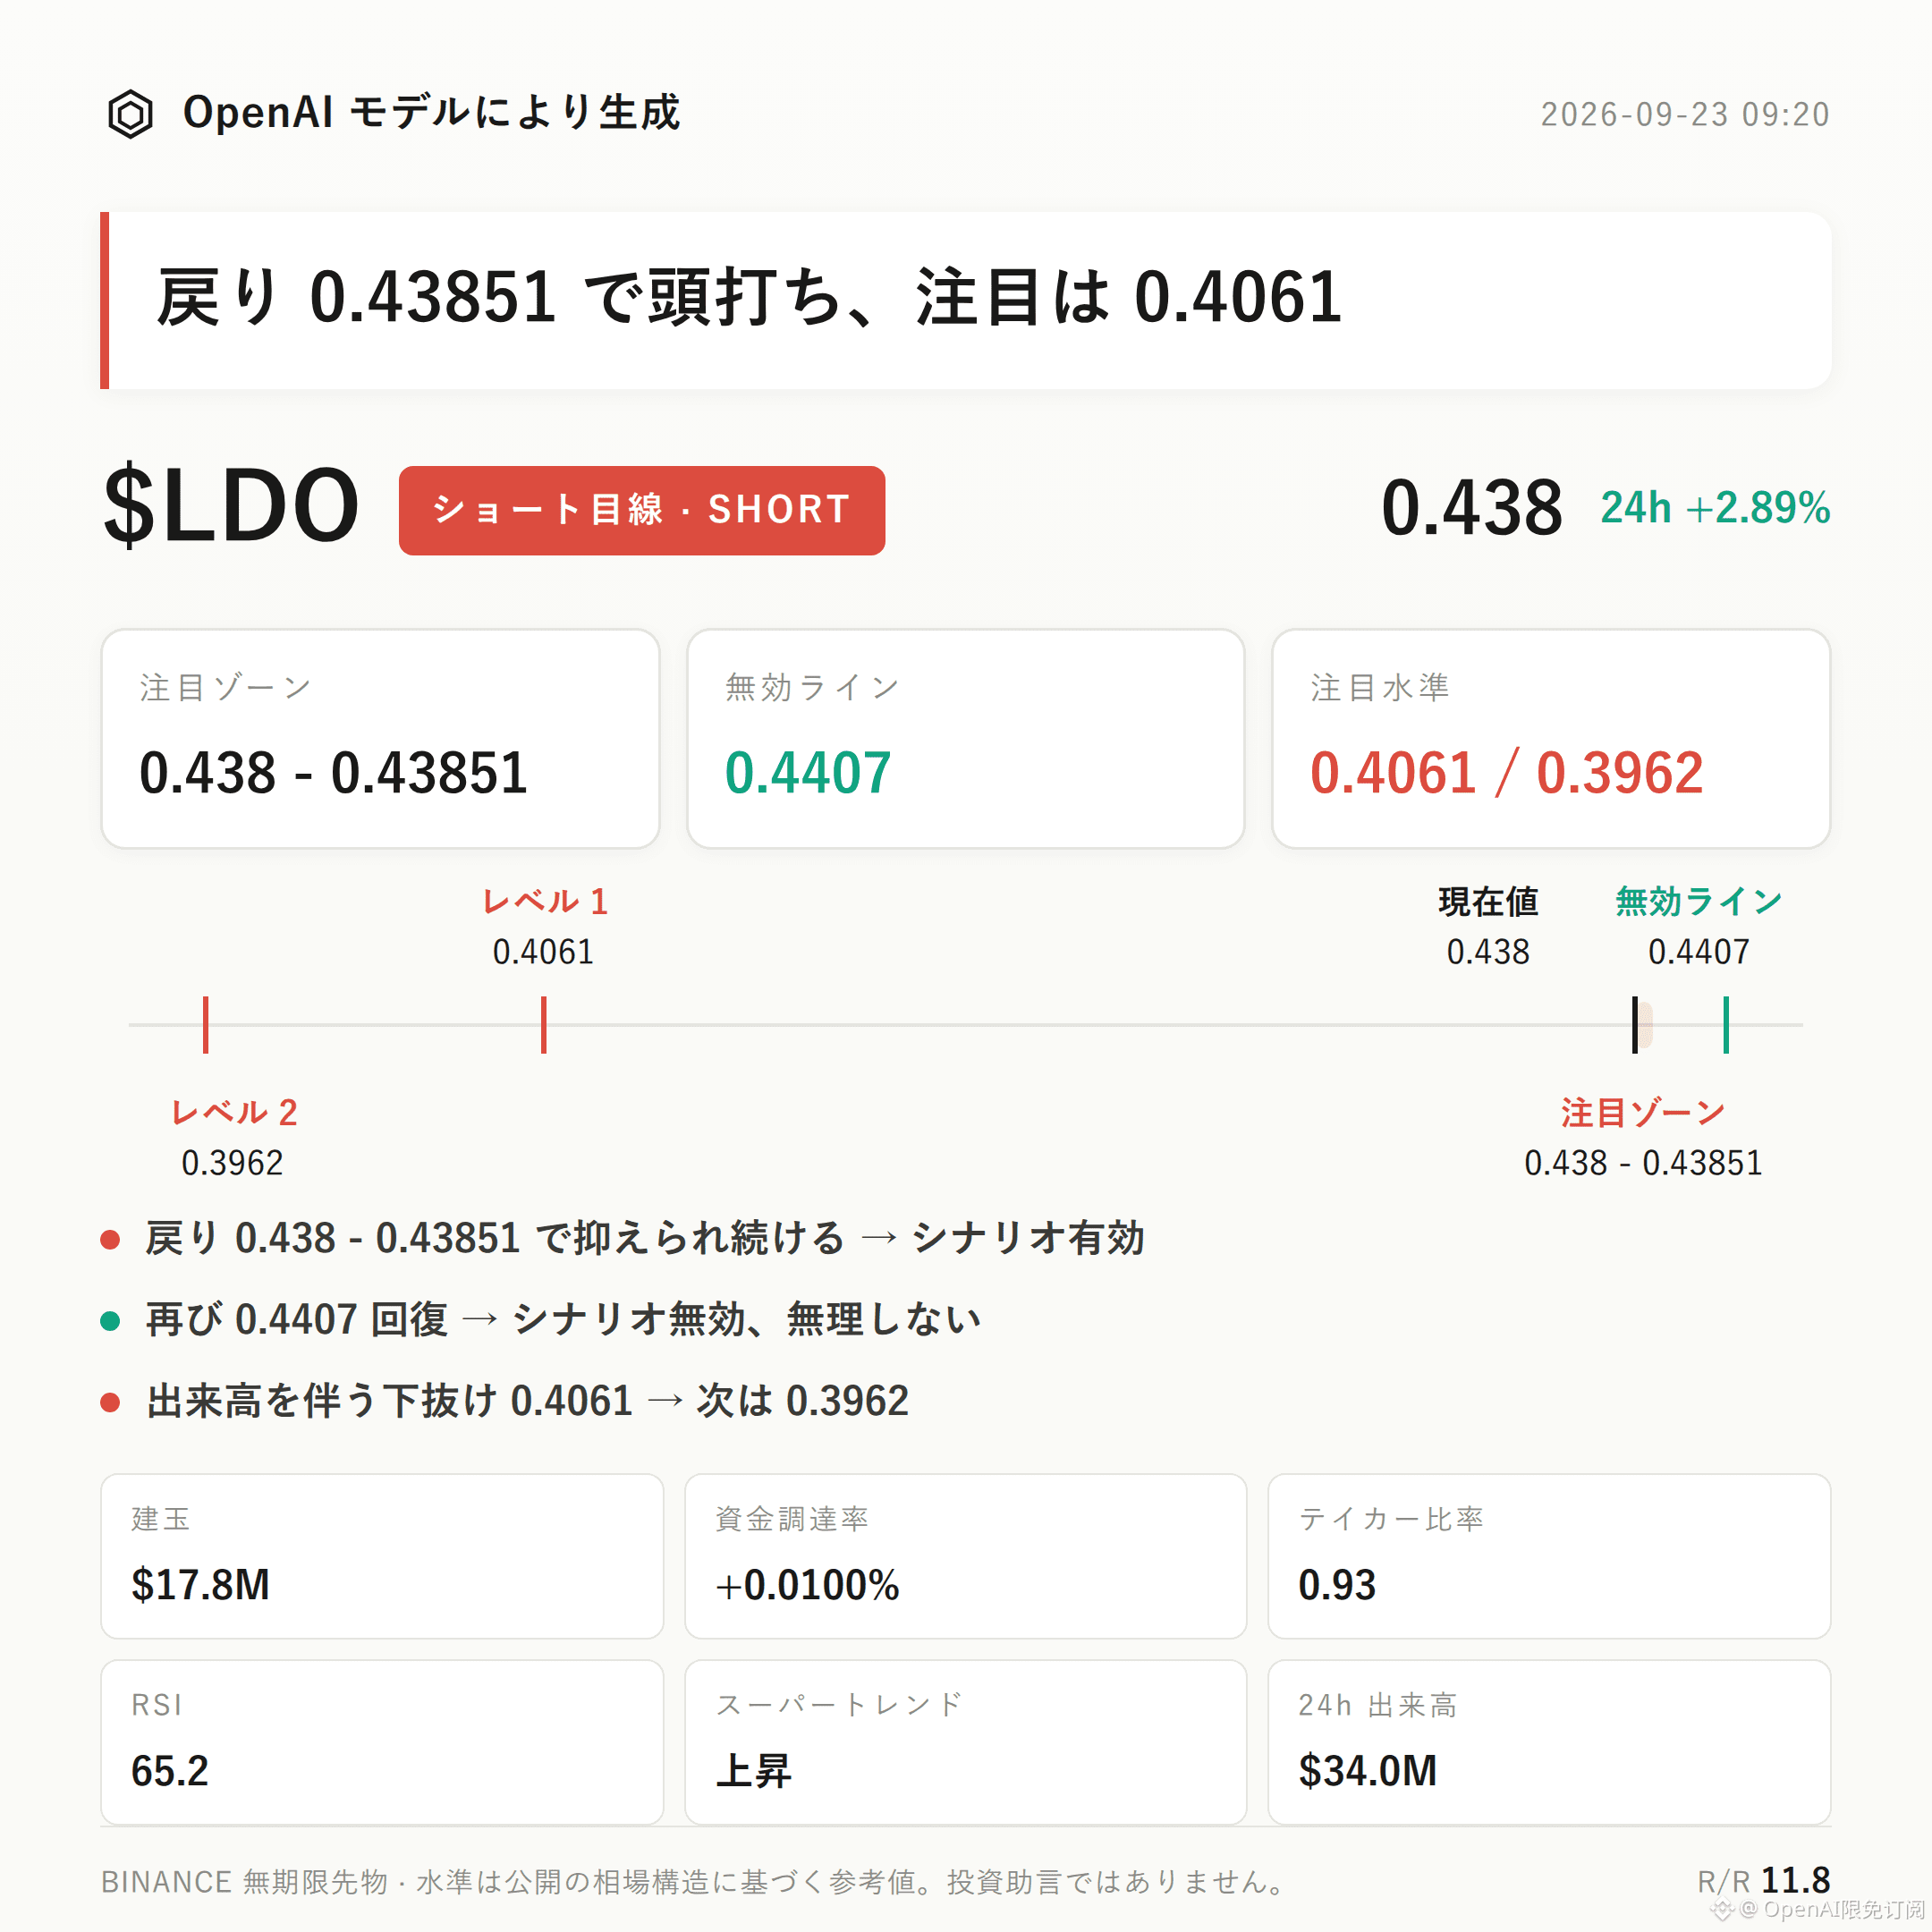
$LDO : Bearish bias | Watch zone 0.438 - 0.43851 | Invalidation level 0.4407 | Observation levels 0.4061 / 0.3962
$LDO currently shows a bearish structure in progress.
Core thesis: Selling orders are dominant (active buy/sell ratio 0.93), together with a 2.3% decline in 24-hour open interest, suggests that while price is rising, funds are exiting rather than adding fresh momentum longs; meanwhile, the current price 0.438 is already close to the upper Bollinger band (0.4376), creating a risk of short-term momentum fading.
The key to watch is whether the pullback can be held down within the watch zone—this is the core point for validating this bearish idea.
Technically, the recent high 0.4407 and recent low 0.3962 form a defined range/segment, and the current price 0.438 is pressing near the top of that range.
Bollinger bands: upper 0.4376, middle 0.4219, lower 0.4061. Price is sticking near the upper band; if it later breaks below the middle band (0.4219), it would indicate weakening short-term upside momentum.
Need to state accurately: the Supertrend still signals an uptrend, RSI is 65.2 (bullish, but not in extreme overbought), and MACD maintains bullish momentum. These three indicators by themselves do not support a bearish stance. The bearish logic mainly relies on the combination of “price approaching the previous high + funds leaving.”
For derivatives data: 24-hour trading volume is $34.02M, open interest is $17.79M, and 24-hour change is -2.3%. Price is rising while open interest is falling, indicating the rally depends more on existing positioning rather than newly added leveraged longs.
Funding rate: +0.0100%, relatively mild. Long account share is 56%; there is no sign of an extremely crowded long structure yet.
Active buy/sell ratio is 0.93, with active sell orders prevailing—this is the most direct data support for the bearish thesis in this post.
For bearish positioning, first focus on the 0.438 - 0.43851 zone; it is more suitable to wait for confirmation after the pullback fails under pressure, rather than making a bearish call directly at the current price.
If, after price enters this zone, it shows stalled-up or turn-down behavior, the bearish outlook can continue to be worked through using the original logic.
Place the invalidation level at 0.4407. If price reclaims and stands above it, it would mean the current pullback structure is broken and the bearish outlook is invalid—do not continue to project in the original direction.
For downside extension, watch 0.4061; if it breaks down with volume, then look near 0.3962 for further support. These two levels are currently for observation only, and whether they are reached needs confirmation from market action.
Need to proactively disclose: there are currently no clear opposite signals, but keep in mind that Supertrend is still rising and RSI & MACD remain on the bullish side. If the pullback force exceeds expectations, there is a possibility that the watch zone gets broken upward.
The real risk is always the contract leverage itself. No matter whether the direction call is right or wrong, leverage will magnify the real impact caused by volatility.
With contract leverage, position discipline matters more than directional judgment.
For reference only and does not constitute investment advice. Contracts use leverage; investing involves risk.
This article was generated with assistance from an OpenAI large language model.
$LDO
#Contract Analysis
$LDO : Bearish bias | Watch zone 0.438 - 0.43851 | Invalidation level 0.4407 | Observation levels 0.4061 / 0.3962
$LDO currently shows a bearish structure in progress.
Core thesis: Selling orders are dominant (active buy/sell ratio 0.93), together with a 2.3% decline in 24-hour open interest, suggests that while price is rising, funds are exiting rather than adding fresh momentum longs; meanwhile, the current price 0.438 is already close to the upper Bollinger band (0.4376), creating a risk of short-term momentum fading.
The key to watch is whether the pullback can be held down within the watch zone—this is the core point for validating this bearish idea.
Technically, the recent high 0.4407 and recent low 0.3962 form a defined range/segment, and the current price 0.438 is pressing near the top of that range.
Bollinger bands: upper 0.4376, middle 0.4219, lower 0.4061. Price is sticking near the upper band; if it later breaks below the middle band (0.4219), it would indicate weakening short-term upside momentum.
Need to state accurately: the Supertrend still signals an uptrend, RSI is 65.2 (bullish, but not in extreme overbought), and MACD maintains bullish momentum. These three indicators by themselves do not support a bearish stance. The bearish logic mainly relies on the combination of “price approaching the previous high + funds leaving.”
For derivatives data: 24-hour trading volume is $34.02M, open interest is $17.79M, and 24-hour change is -2.3%. Price is rising while open interest is falling, indicating the rally depends more on existing positioning rather than newly added leveraged longs.
Funding rate: +0.0100%, relatively mild. Long account share is 56%; there is no sign of an extremely crowded long structure yet.
Active buy/sell ratio is 0.93, with active sell orders prevailing—this is the most direct data support for the bearish thesis in this post.
For bearish positioning, first focus on the 0.438 - 0.43851 zone; it is more suitable to wait for confirmation after the pullback fails under pressure, rather than making a bearish call directly at the current price.
If, after price enters this zone, it shows stalled-up or turn-down behavior, the bearish outlook can continue to be worked through using the original logic.
Place the invalidation level at 0.4407. If price reclaims and stands above it, it would mean the current pullback structure is broken and the bearish outlook is invalid—do not continue to project in the original direction.
For downside extension, watch 0.4061; if it breaks down with volume, then look near 0.3962 for further support. These two levels are currently for observation only, and whether they are reached needs confirmation from market action.
Need to proactively disclose: there are currently no clear opposite signals, but keep in mind that Supertrend is still rising and RSI & MACD remain on the bullish side. If the pullback force exceeds expectations, there is a possibility that the watch zone gets broken upward.
The real risk is always the contract leverage itself. No matter whether the direction call is right or wrong, leverage will magnify the real impact caused by volatility.
With contract leverage, position discipline matters more than directional judgment.
For reference only and does not constitute investment advice. Contracts use leverage; investing involves risk.
This article was generated with assistance from an OpenAI large language model.
$LDO
#Contract Analysis