🔥 $BTC Hitting the $86,500 area! Imminent Breakout or Liquidity Trap? 🚀📉
Hello, Community! 👋 Let’s analyze the real-time data the market is giving us for BTC/USDT and what the key derivatives and Smart Money indicators are telling us:
📊 1. Price and Technical Analysis (15m):
Current price: ~$86,478 USD.
Bollinger Bands and EMAs: Price is compressed, trading near the middle band and bouncing above the fast moving averages (EMA 21/200).
RSI: In the middle zone (~57.7), indicating balance without overbought conditions, ideal for building momentum before a strong move.
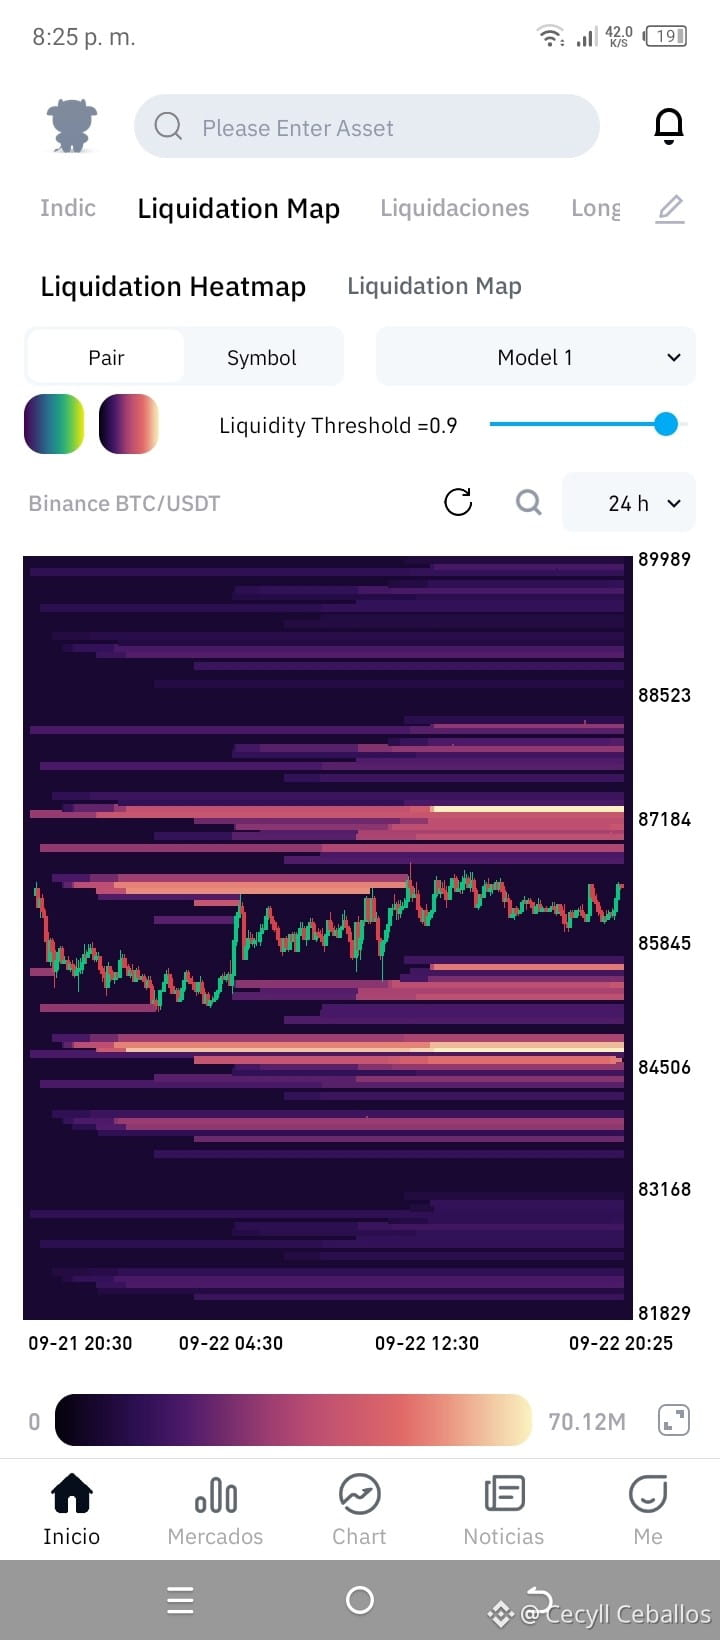
🔥 2. Liquidation Heatmap (Coinglass):
Key blocks:
Resistance / upper sweep zones: Around $87,180 - $87,200 there is a dense band of liquidations waiting to be swept.
Support / lower sweep zones: Strong support zone and accumulated long liquidations near $85,800 and $84,500.
💰 3. Open Interest (OI) and Funding Rate:
Funding: Neutral/low and healthy rates (Binance 0.0017%, OKX 0.0022%, Bybit 0.0067%). The market is not excessively leveraged in longs, which reduces the risk of a sudden bearish liquidation cascade.
Open Interest: Sustained growth in futures OI, signaling fresh capital entering and positioning for the next major move.
💡 Analysis Conclusion:
Bitcoin is reconsolidating strength above $86,000. As long as support at $85,800 holds firm, the path of least resistance points toward seeking the liquidity built up in the $87,200+ range.
💬 What do you think, community? Are we going to go after $88k or correct first? Leave me your comment below. 👇
👍 If you liked this analysis, give me a Like!
🔔 If you follow me, I’ll follow you!
#Bitcoin #BTC #CryptoAnalysis #BinanceSquare #TechnicalAnalysis #LiquidationHeatmap #Futures Trading #CryptoMarket
Hello, Community! 👋 Let’s analyze the real-time data the market is giving us for BTC/USDT and what the key derivatives and Smart Money indicators are telling us:
📊 1. Price and Technical Analysis (15m):
Current price: ~$86,478 USD.
Bollinger Bands and EMAs: Price is compressed, trading near the middle band and bouncing above the fast moving averages (EMA 21/200).
RSI: In the middle zone (~57.7), indicating balance without overbought conditions, ideal for building momentum before a strong move.
🔥 2. Liquidation Heatmap (Coinglass):
Key blocks:
Resistance / upper sweep zones: Around $87,180 - $87,200 there is a dense band of liquidations waiting to be swept.
Support / lower sweep zones: Strong support zone and accumulated long liquidations near $85,800 and $84,500.
💰 3. Open Interest (OI) and Funding Rate:
Funding: Neutral/low and healthy rates (Binance 0.0017%, OKX 0.0022%, Bybit 0.0067%). The market is not excessively leveraged in longs, which reduces the risk of a sudden bearish liquidation cascade.
Open Interest: Sustained growth in futures OI, signaling fresh capital entering and positioning for the next major move.
💡 Analysis Conclusion:
Bitcoin is reconsolidating strength above $86,000. As long as support at $85,800 holds firm, the path of least resistance points toward seeking the liquidity built up in the $87,200+ range.
💬 What do you think, community? Are we going to go after $88k or correct first? Leave me your comment below. 👇
👍 If you liked this analysis, give me a Like!
🔔 If you follow me, I’ll follow you!
#Bitcoin #BTC #CryptoAnalysis #BinanceSquare #TechnicalAnalysis #LiquidationHeatmap #Futures Trading #CryptoMarket