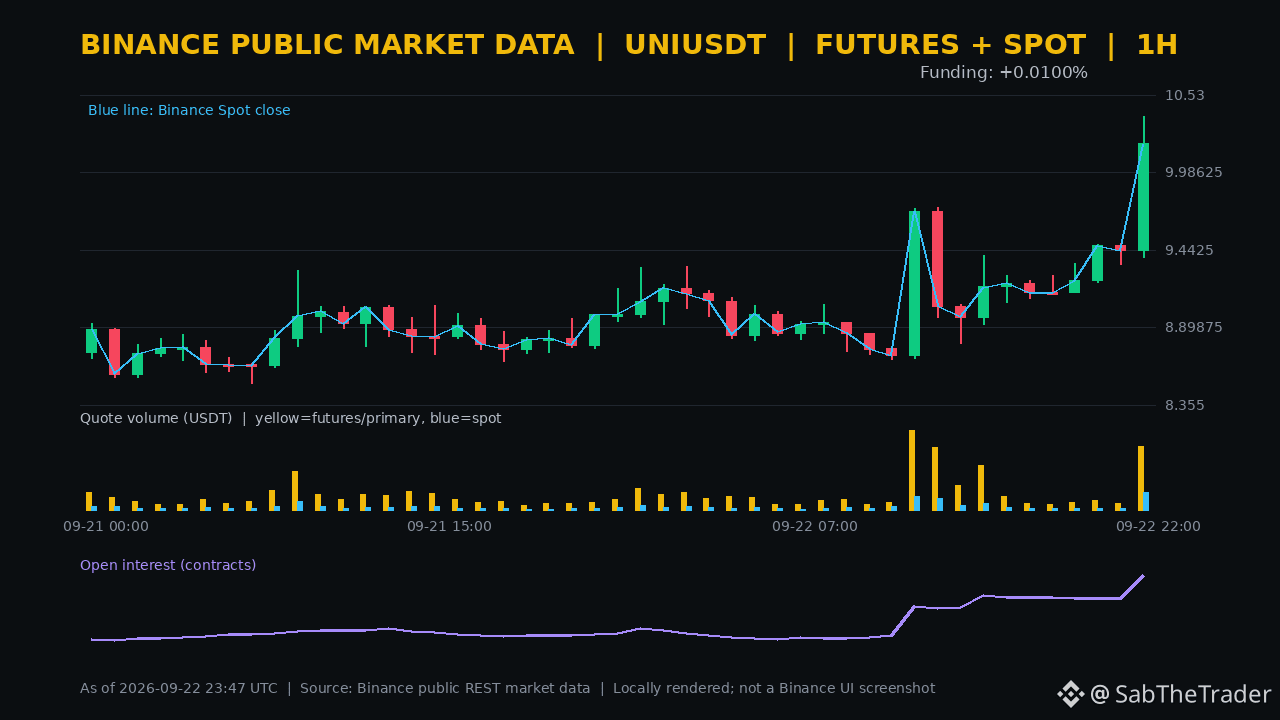
UNI compresses the main incremental movement of 24-hour market conditions into a single 1-hour K-line. According to public Binance data at 07:47 (UTC+8), spot price for $UNI is 10.216, up 13.93% over the past 24 hours; the perpetual contract is 10.234, up 14.22%, with roughly 1.031 billion USDT in 24-hour trading volume.
In the previous complete 1 hour, it rose from 9.437 to 10.190, up 7.98%. Perpetual trading volume was about 132 million USDT, increasing 817.83% month-over-month. Spot was up 7.87% over the same period, with trading volume up 847.40% month-over-month; OI (open interest) by quantity increased 8.75% over 1 hour and 25.10% over 30 hours. Price, trading volume, and positions all accelerated at the same time—short-term momentum is clear, but leverage risk is rising in parallel.
Funding did not run to extremes along with the price increase: the next period’s indicator is +0.0100%, and the most recent actual settlement was also +0.0100%. This suggests current position costs are still close to normal, so it cannot be used to infer the net long-versus-short direction of newly added positions. If trading activity fades, high OI could amplify a pullback.
First, I’m watching the breakout range of 9.391—10.380. Only if a retest holds 9.391 and then breaks above 10.380 with increased volume can it be considered that upside space is still opening. If it falls back below 9.391 and OI simultaneously contracts, prioritize deleveraging after the breakout fails—do not chase higher prices.
In the previous complete 1 hour, it rose from 9.437 to 10.190, up 7.98%. Perpetual trading volume was about 132 million USDT, increasing 817.83% month-over-month. Spot was up 7.87% over the same period, with trading volume up 847.40% month-over-month; OI (open interest) by quantity increased 8.75% over 1 hour and 25.10% over 30 hours. Price, trading volume, and positions all accelerated at the same time—short-term momentum is clear, but leverage risk is rising in parallel.
Funding did not run to extremes along with the price increase: the next period’s indicator is +0.0100%, and the most recent actual settlement was also +0.0100%. This suggests current position costs are still close to normal, so it cannot be used to infer the net long-versus-short direction of newly added positions. If trading activity fades, high OI could amplify a pullback.
First, I’m watching the breakout range of 9.391—10.380. Only if a retest holds 9.391 and then breaks above 10.380 with increased volume can it be considered that upside space is still opening. If it falls back below 9.391 and OI simultaneously contracts, prioritize deleveraging after the breakout fails—do not chase higher prices.