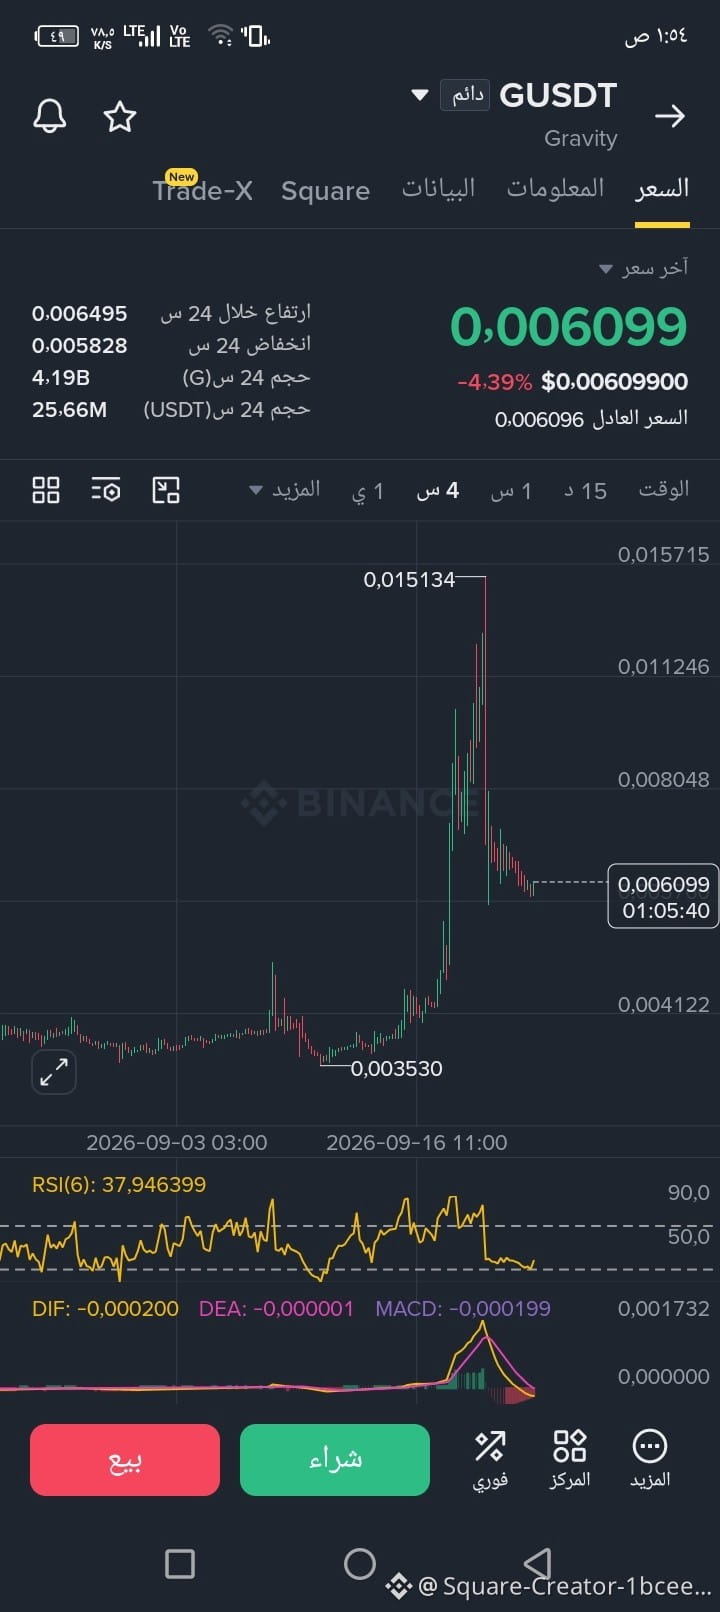
This analysis for /USDT (Gravity)$G on the 4-hour timeframe:
📊 Current Situation
Price: 0.006099$
Last Peak: 0.015134$
Previous Low: 0.003530$
RSI: 37.95 → weak momentum, close to the oversold zone.
MACD: negative → sellers are still in control right now.
🔴 Support
0.0058–0.0060: the current zone, and it is important.
0.00412: stronger support if the current support fails.
0.00353: the previous low.
🟢 Resistances
0.0065–0.0068: the first zone that should be reclaimed.
0.00805: a clear resistance.
0.01125: a higher resistance.
0.01513: the last peak.
🔎 Technical Scenario
After the quick rally to 0.01513$, a strong drop followed, and the current candles are moving downward in a gradual manner. Therefore, there is no confirmation of an upward reversal yet.
If the price holds 0.0058–0.0060$ and starts closing the 4-hour candles above 0.0065–0.0068$, this would provide a sign of technical improvement, and it may test 0.00805$.
On the other hand, a break below 0.0058$ would make 0.00412$ the next area worth monitoring.
Conclusion: the coin is currently in a support-testing phase after a sharp drop; the most important thing is to watch 0.0058$ as support and 0.0068$ as resistance.
📊 Current Situation
Price: 0.006099$
Last Peak: 0.015134$
Previous Low: 0.003530$
RSI: 37.95 → weak momentum, close to the oversold zone.
MACD: negative → sellers are still in control right now.
🔴 Support
0.0058–0.0060: the current zone, and it is important.
0.00412: stronger support if the current support fails.
0.00353: the previous low.
🟢 Resistances
0.0065–0.0068: the first zone that should be reclaimed.
0.00805: a clear resistance.
0.01125: a higher resistance.
0.01513: the last peak.
🔎 Technical Scenario
After the quick rally to 0.01513$, a strong drop followed, and the current candles are moving downward in a gradual manner. Therefore, there is no confirmation of an upward reversal yet.
If the price holds 0.0058–0.0060$ and starts closing the 4-hour candles above 0.0065–0.0068$, this would provide a sign of technical improvement, and it may test 0.00805$.
On the other hand, a break below 0.0058$ would make 0.00412$ the next area worth monitoring.
Conclusion: the coin is currently in a support-testing phase after a sharp drop; the most important thing is to watch 0.0058$ as support and 0.0068$ as resistance.