#Bitcoin❗ $BTC 🤫
$Bitcoin ($BTC ) has experienced significant structural shifts pushing its price toward high targets like $100,000.
Key Drivers Behind the Bullish Momentum
Spot ETF Capital Inflows: Institutional demand via Spot BTC ETFs continues to absorb daily supply. Single-day net inflows exceeding hundreds of millions of dollars reduce exchange reserves and create a persistent buy-side pressure.
Post-Halving Supply Squeeze: Bitcoin's block rewards cut issuing supply in half, creating a structural supply deficit as institutional demand scales up.
Macroeconomic Policy Shifts: Global rate cuts (such as Federal Reserve easing cycles) increase global M2 liquidity, traditionally pushing institutional capital into scarce risk assets like Bitcoin and Gold.
Corporate Treasury Adoption: Publicly traded companies continue to follow treasury strategies holding BTC on their balance sheets, further locking up circulating supply.
How to Read the Technical Chart
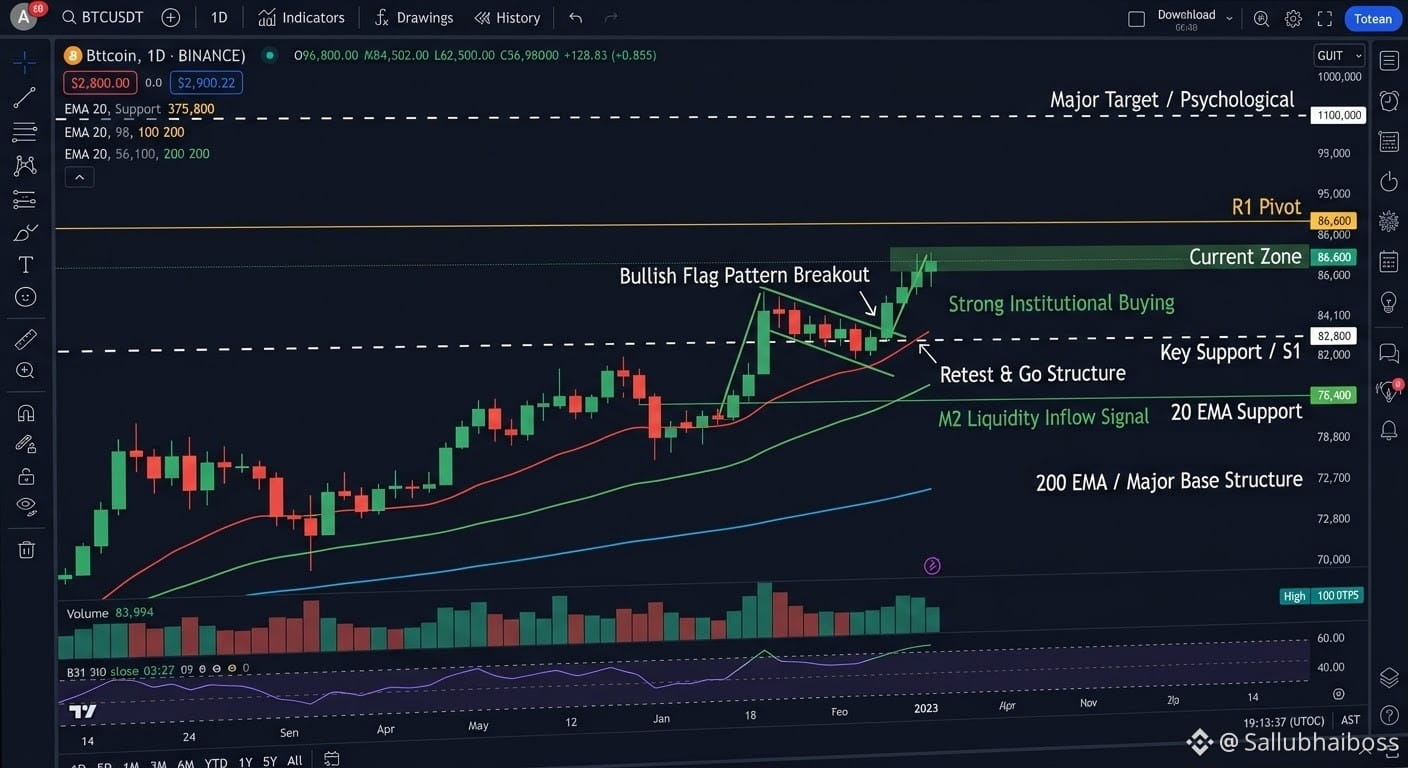
Breakout & Retest Structure: Price action holding cleanly above key support levels ($82,800–$84,000 zone) confirms buyers are absorbing taking-profit sell orders without letting the price pull back deep into lower value zones.
Moving Average Alignment: On higher timeframes (Daily and Weekly), the 20-day, 50-day, and 200-day EMAs are stacked in upward order, signaling a sustained macro uptrend rather than a short-term pump.
Liquidity Sweep to $100k: The $100,000 region represents a major psychological round number filled with short-liquidation pools and option limit orders. Clean upside continuation through key pivot targets (like $88,900) usually clears the way for price discovery toward six-figure levels.
$Bitcoin ($BTC ) has experienced significant structural shifts pushing its price toward high targets like $100,000.
Key Drivers Behind the Bullish Momentum
Spot ETF Capital Inflows: Institutional demand via Spot BTC ETFs continues to absorb daily supply. Single-day net inflows exceeding hundreds of millions of dollars reduce exchange reserves and create a persistent buy-side pressure.
Post-Halving Supply Squeeze: Bitcoin's block rewards cut issuing supply in half, creating a structural supply deficit as institutional demand scales up.
Macroeconomic Policy Shifts: Global rate cuts (such as Federal Reserve easing cycles) increase global M2 liquidity, traditionally pushing institutional capital into scarce risk assets like Bitcoin and Gold.
Corporate Treasury Adoption: Publicly traded companies continue to follow treasury strategies holding BTC on their balance sheets, further locking up circulating supply.
How to Read the Technical Chart
Breakout & Retest Structure: Price action holding cleanly above key support levels ($82,800–$84,000 zone) confirms buyers are absorbing taking-profit sell orders without letting the price pull back deep into lower value zones.
Moving Average Alignment: On higher timeframes (Daily and Weekly), the 20-day, 50-day, and 200-day EMAs are stacked in upward order, signaling a sustained macro uptrend rather than a short-term pump.
Liquidity Sweep to $100k: The $100,000 region represents a major psychological round number filled with short-liquidation pools and option limit orders. Clean upside continuation through key pivot targets (like $88,900) usually clears the way for price discovery toward six-figure levels.