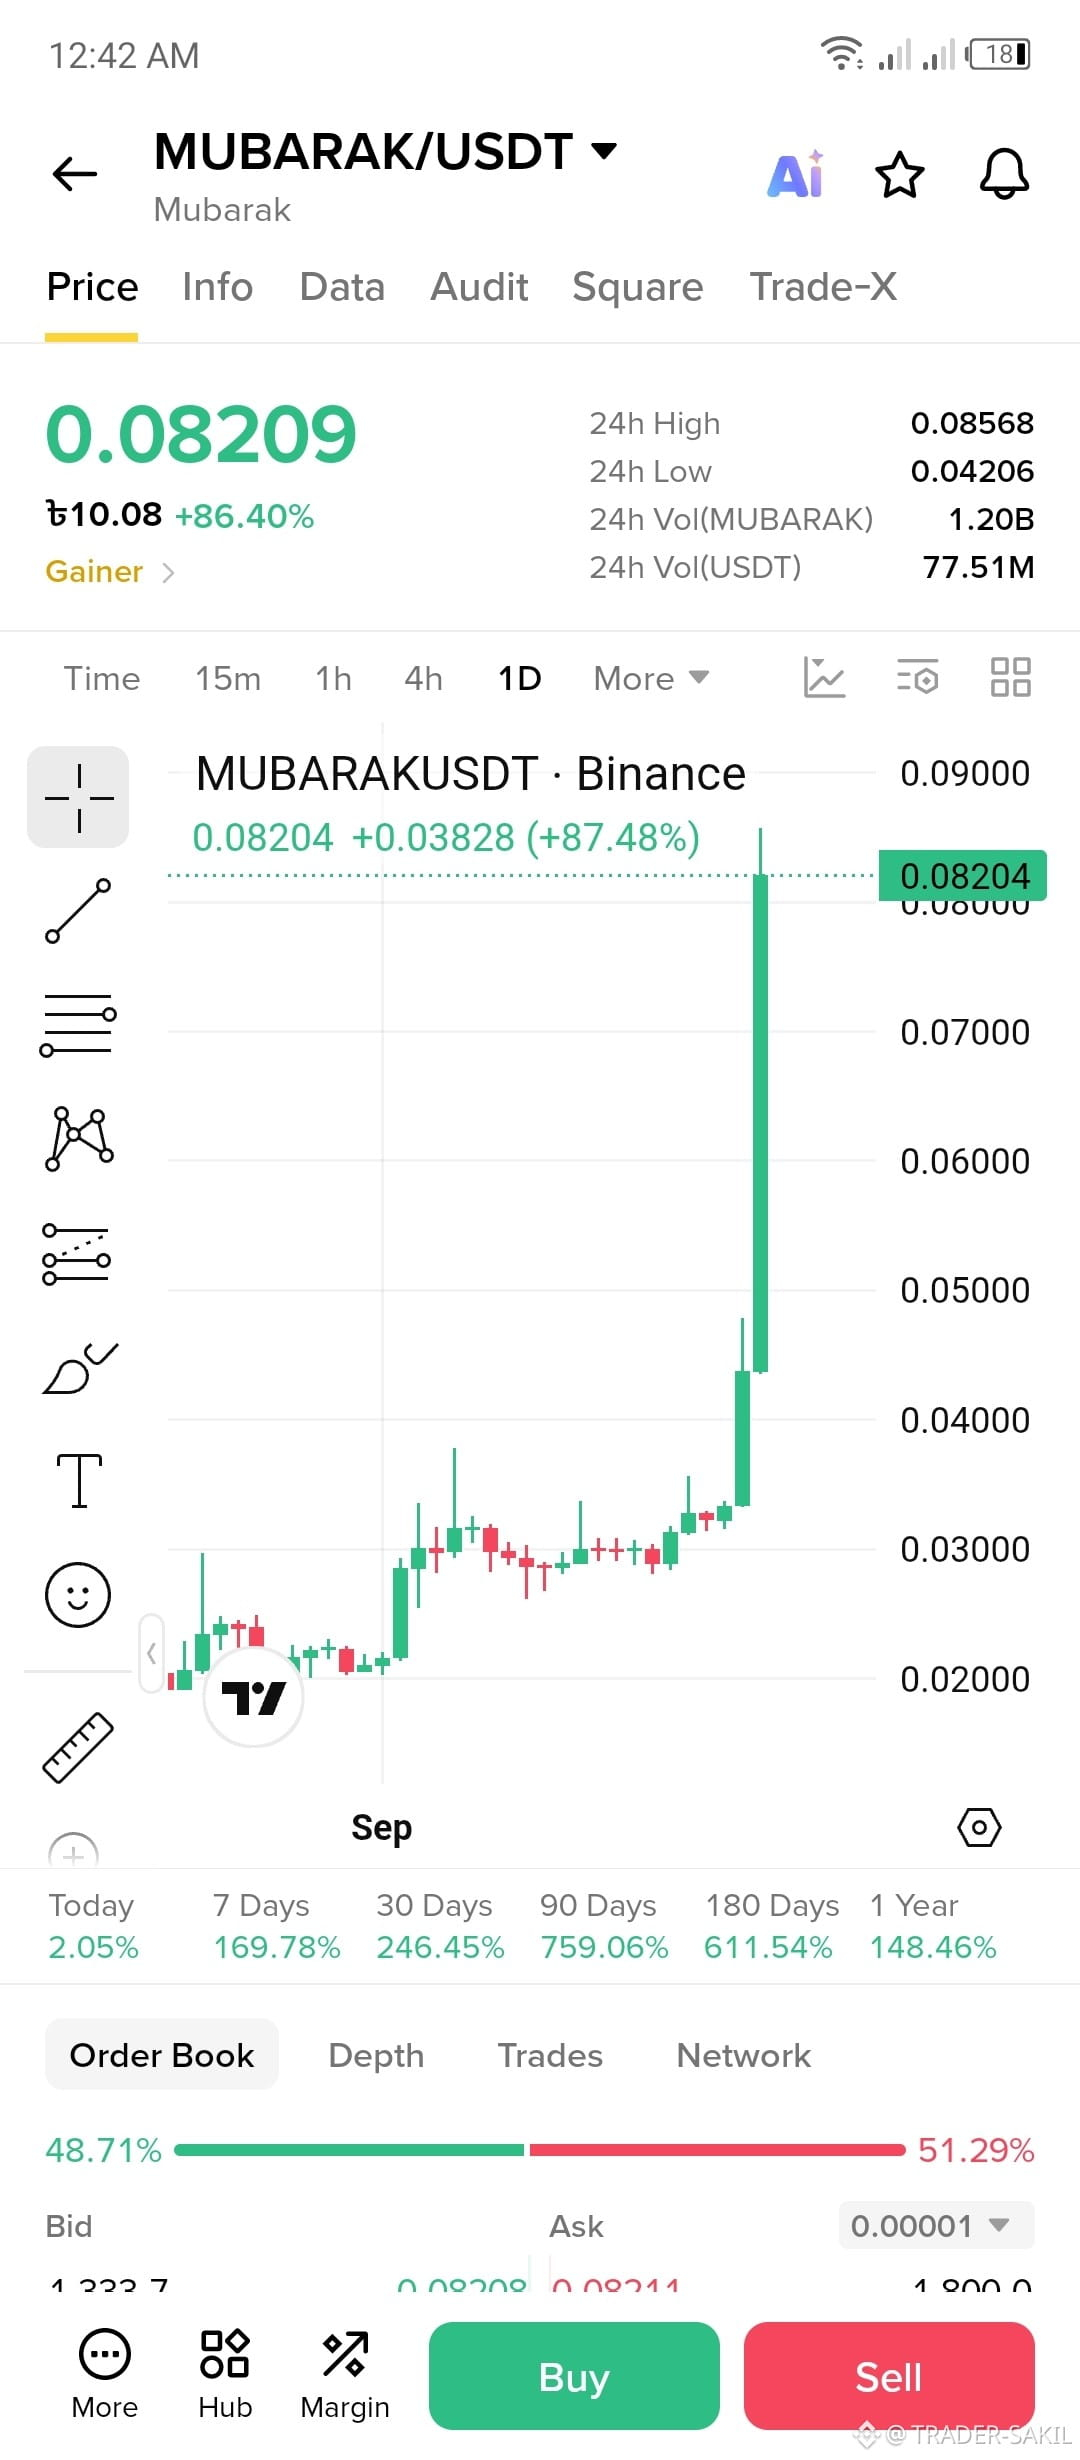
$MUBARAK /USDT 1-day (1D) Binance chart.
📊 What the chart shows
Current price: about $0.08209
24h change: +86.40%
24h high: $0.08568
24h low: $0.04206
24h volume: about $77.51M USDT
The visible chart shows a major breakout from the $0.03–$0.04 region toward $0.08+.
📈 Main trend
The overall short-term structure is strongly bullish, with a very large daily green candle.
Price previously spent considerable time roughly around $0.02–$0.033, then moved higher. The most recent move accelerated sharply:
~$0.03 → ~$0.043
Then ~$0.043 → ~$0.082
That represents a very rapid repricing rather than a gradual trend.
🔑 Important levels visible on this chart
$0.08: immediate psychological/support area
$0.085–$0.086: current resistance/24h-high zone
$0.09: next obvious psychological resistance
$0.07: potential pullback area
$0.05–$0.045: deeper support zone
$0.03–$0.033: previous consolidation area
⚠️ Important caveats
The +86% daily move is unusually large, so chasing the candle can carry substantial volatility risk. A large green candle alone does not establish that the price will continue upward.
Also, the chart is visually dominated by the latest candle, which can make the earlier price action look insignificant. The 1D timeframe provides very limited detail about intraday support/resistance. For a more precise analysis, the 4H or 1H chart would help.
The order book shown at the bottom is roughly 48.71% bid vs. 51.29% ask, but this is only a snapshot and can change quickly; it shouldn't be treated as a reliable prediction of direction.
In short: MUBARAK has experienced an explosive breakout, with price currently near $0.082 and testing the $0.085–$0.09 region. The key question from this chart is whether price can consolidate above the breakout area or retrace after the unusually large move.
📊 What the chart shows
Current price: about $0.08209
24h change: +86.40%
24h high: $0.08568
24h low: $0.04206
24h volume: about $77.51M USDT
The visible chart shows a major breakout from the $0.03–$0.04 region toward $0.08+.
📈 Main trend
The overall short-term structure is strongly bullish, with a very large daily green candle.
Price previously spent considerable time roughly around $0.02–$0.033, then moved higher. The most recent move accelerated sharply:
~$0.03 → ~$0.043
Then ~$0.043 → ~$0.082
That represents a very rapid repricing rather than a gradual trend.
🔑 Important levels visible on this chart
$0.08: immediate psychological/support area
$0.085–$0.086: current resistance/24h-high zone
$0.09: next obvious psychological resistance
$0.07: potential pullback area
$0.05–$0.045: deeper support zone
$0.03–$0.033: previous consolidation area
⚠️ Important caveats
The +86% daily move is unusually large, so chasing the candle can carry substantial volatility risk. A large green candle alone does not establish that the price will continue upward.
Also, the chart is visually dominated by the latest candle, which can make the earlier price action look insignificant. The 1D timeframe provides very limited detail about intraday support/resistance. For a more precise analysis, the 4H or 1H chart would help.
The order book shown at the bottom is roughly 48.71% bid vs. 51.29% ask, but this is only a snapshot and can change quickly; it shouldn't be treated as a reliable prediction of direction.
In short: MUBARAK has experienced an explosive breakout, with price currently near $0.082 and testing the $0.085–$0.09 region. The key question from this chart is whether price can consolidate above the breakout area or retrace after the unusually large move.