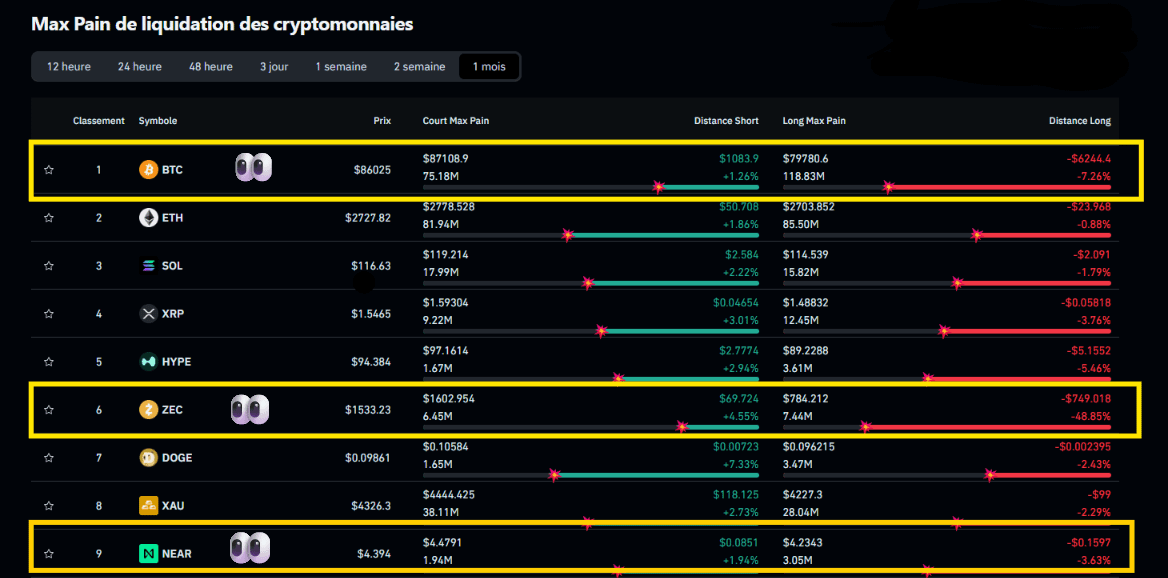

$BTC and $ZEC in front of a completely different picture from $NEAR … and the reason on the liquidation map. ⚠️
When looking at Max Pain data across the month, we notice a clear difference in the distance between the liquidation zones for Shorts and Longs:
🔸 $BTC: Price ~86K$
Shorts: 87.1K$ | Longs: 79.8K$
🔸 $ZEC: Price ~1,533$
Shorts: 1,603$ | Longs: 784$
Here, the liquidation areas are far apart, meaning the price needs a larger move to reach them—so liquidation isn’t close enough to create a fast impulse in price movement.
But $NEAR shows a different picture:
Price 4.39$
Shorts: 4.47$ | Longs: 4.23$
Here, the liquidation zones are very close to the current price.
This makes the price more sensitive; if the impulse starts toward one of these zones, it can be reached quickly—and with liquidation triggered, momentum may increase, pushing the price into a fast move upward or downward.
📌 Simply put:
Far-apart liquidation → more space for movement → less direct pressure → less sensitivity to moves.
Close liquidation → small space for movement → higher sensitivity → higher chance of a faster impulse up or down.
So when reading the liquidation map, I don’t just need to know the liquidation volume; the most important thing is where it is and the distance between it and the current price.
When looking at Max Pain data across the month, we notice a clear difference in the distance between the liquidation zones for Shorts and Longs:
🔸 $BTC: Price ~86K$
Shorts: 87.1K$ | Longs: 79.8K$
🔸 $ZEC: Price ~1,533$
Shorts: 1,603$ | Longs: 784$
Here, the liquidation areas are far apart, meaning the price needs a larger move to reach them—so liquidation isn’t close enough to create a fast impulse in price movement.
But $NEAR shows a different picture:
Price 4.39$
Shorts: 4.47$ | Longs: 4.23$
Here, the liquidation zones are very close to the current price.
This makes the price more sensitive; if the impulse starts toward one of these zones, it can be reached quickly—and with liquidation triggered, momentum may increase, pushing the price into a fast move upward or downward.
📌 Simply put:
Far-apart liquidation → more space for movement → less direct pressure → less sensitivity to moves.
Close liquidation → small space for movement → higher sensitivity → higher chance of a faster impulse up or down.
So when reading the liquidation map, I don’t just need to know the liquidation volume; the most important thing is where it is and the distance between it and the current price.