This is a chart $ZEC
/USDT on the 4-hour timeframe, the uptrend is still solid, but the price is moving within a consolidation zone below the peak.
📈 Trend
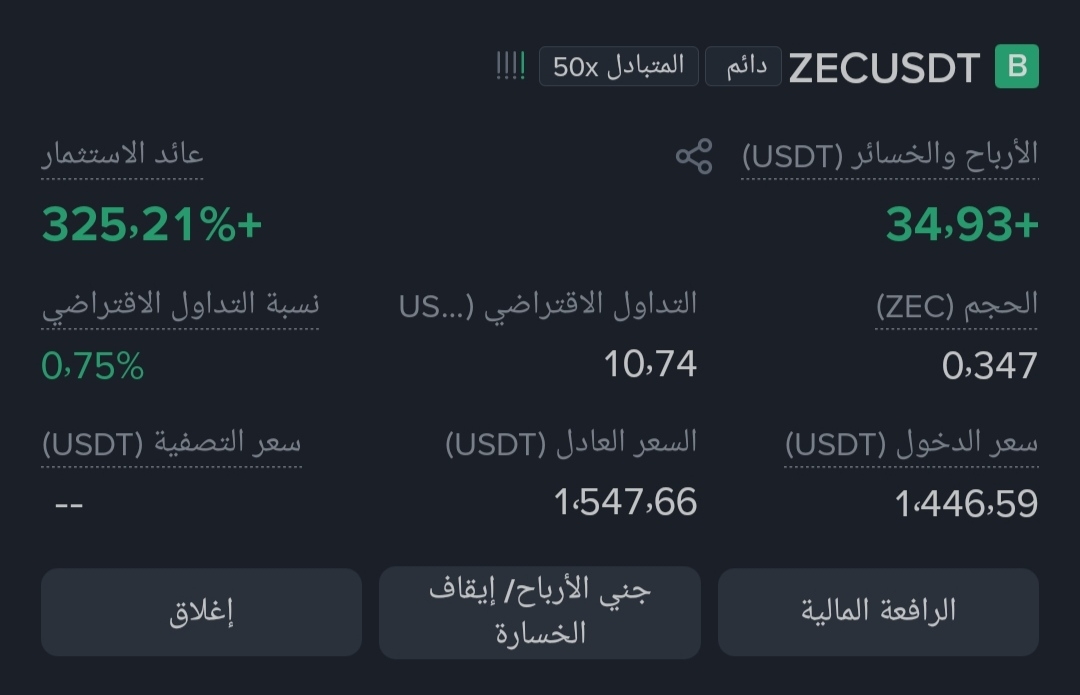
Current price: 1545.57
MA7 = 1505.56
MA25 = 1502.43
MA99 = 1278.26
The price is above MA7, MA25, and MA99, and MA7 and MA25 are much higher than MA99, indicating that the overall trend is still bullish.
🔴 Resistance
The most important zone is:
1595–1600 ← The last peak, which is the main resistance.
If a breakout and 4-hour close above 1600 occurs, then watch the zone around 1635 afterward, then higher levels depending on the strength of the breakout.
🟢 Supports
1500–1505: nearby and important support, aligned with MA7 and MA25.
1435–1445: stronger support; losing this area weakens the current upward momentum.
1275–1280: a far support that roughly matches MA99.
📊 Indicators
RSI(6) = 65.15
There is no severe buying oversaturation, so there is currently no RSI-only signal indicating the need for a pullback. But it is near the strength zone, so a breakout requires good volume.
OBV rose strongly with the rally, then saw a slight pullback, and now it shows improvement—this is better than having a clear and continuous decline in OBV.
Important scenarios
Bullish scenario:
Holding above 1500, then breaking 1595–1600 with a 4-hour close → a technical signal for the continuation of the uptrend.
Corrective scenario:
Break of 1500 → likely test of 1435–1445.
And breaking this zone makes the correction deeper.
Summary:
The chart is currently bullish but under a very strong resistance at 1595–1600. The main thing I’m watching is whether price can break the high or fails and returns to 1500.
#BitcoinBreaksAboveMayHighNears$86K