Trading Idea|9/23 01:20
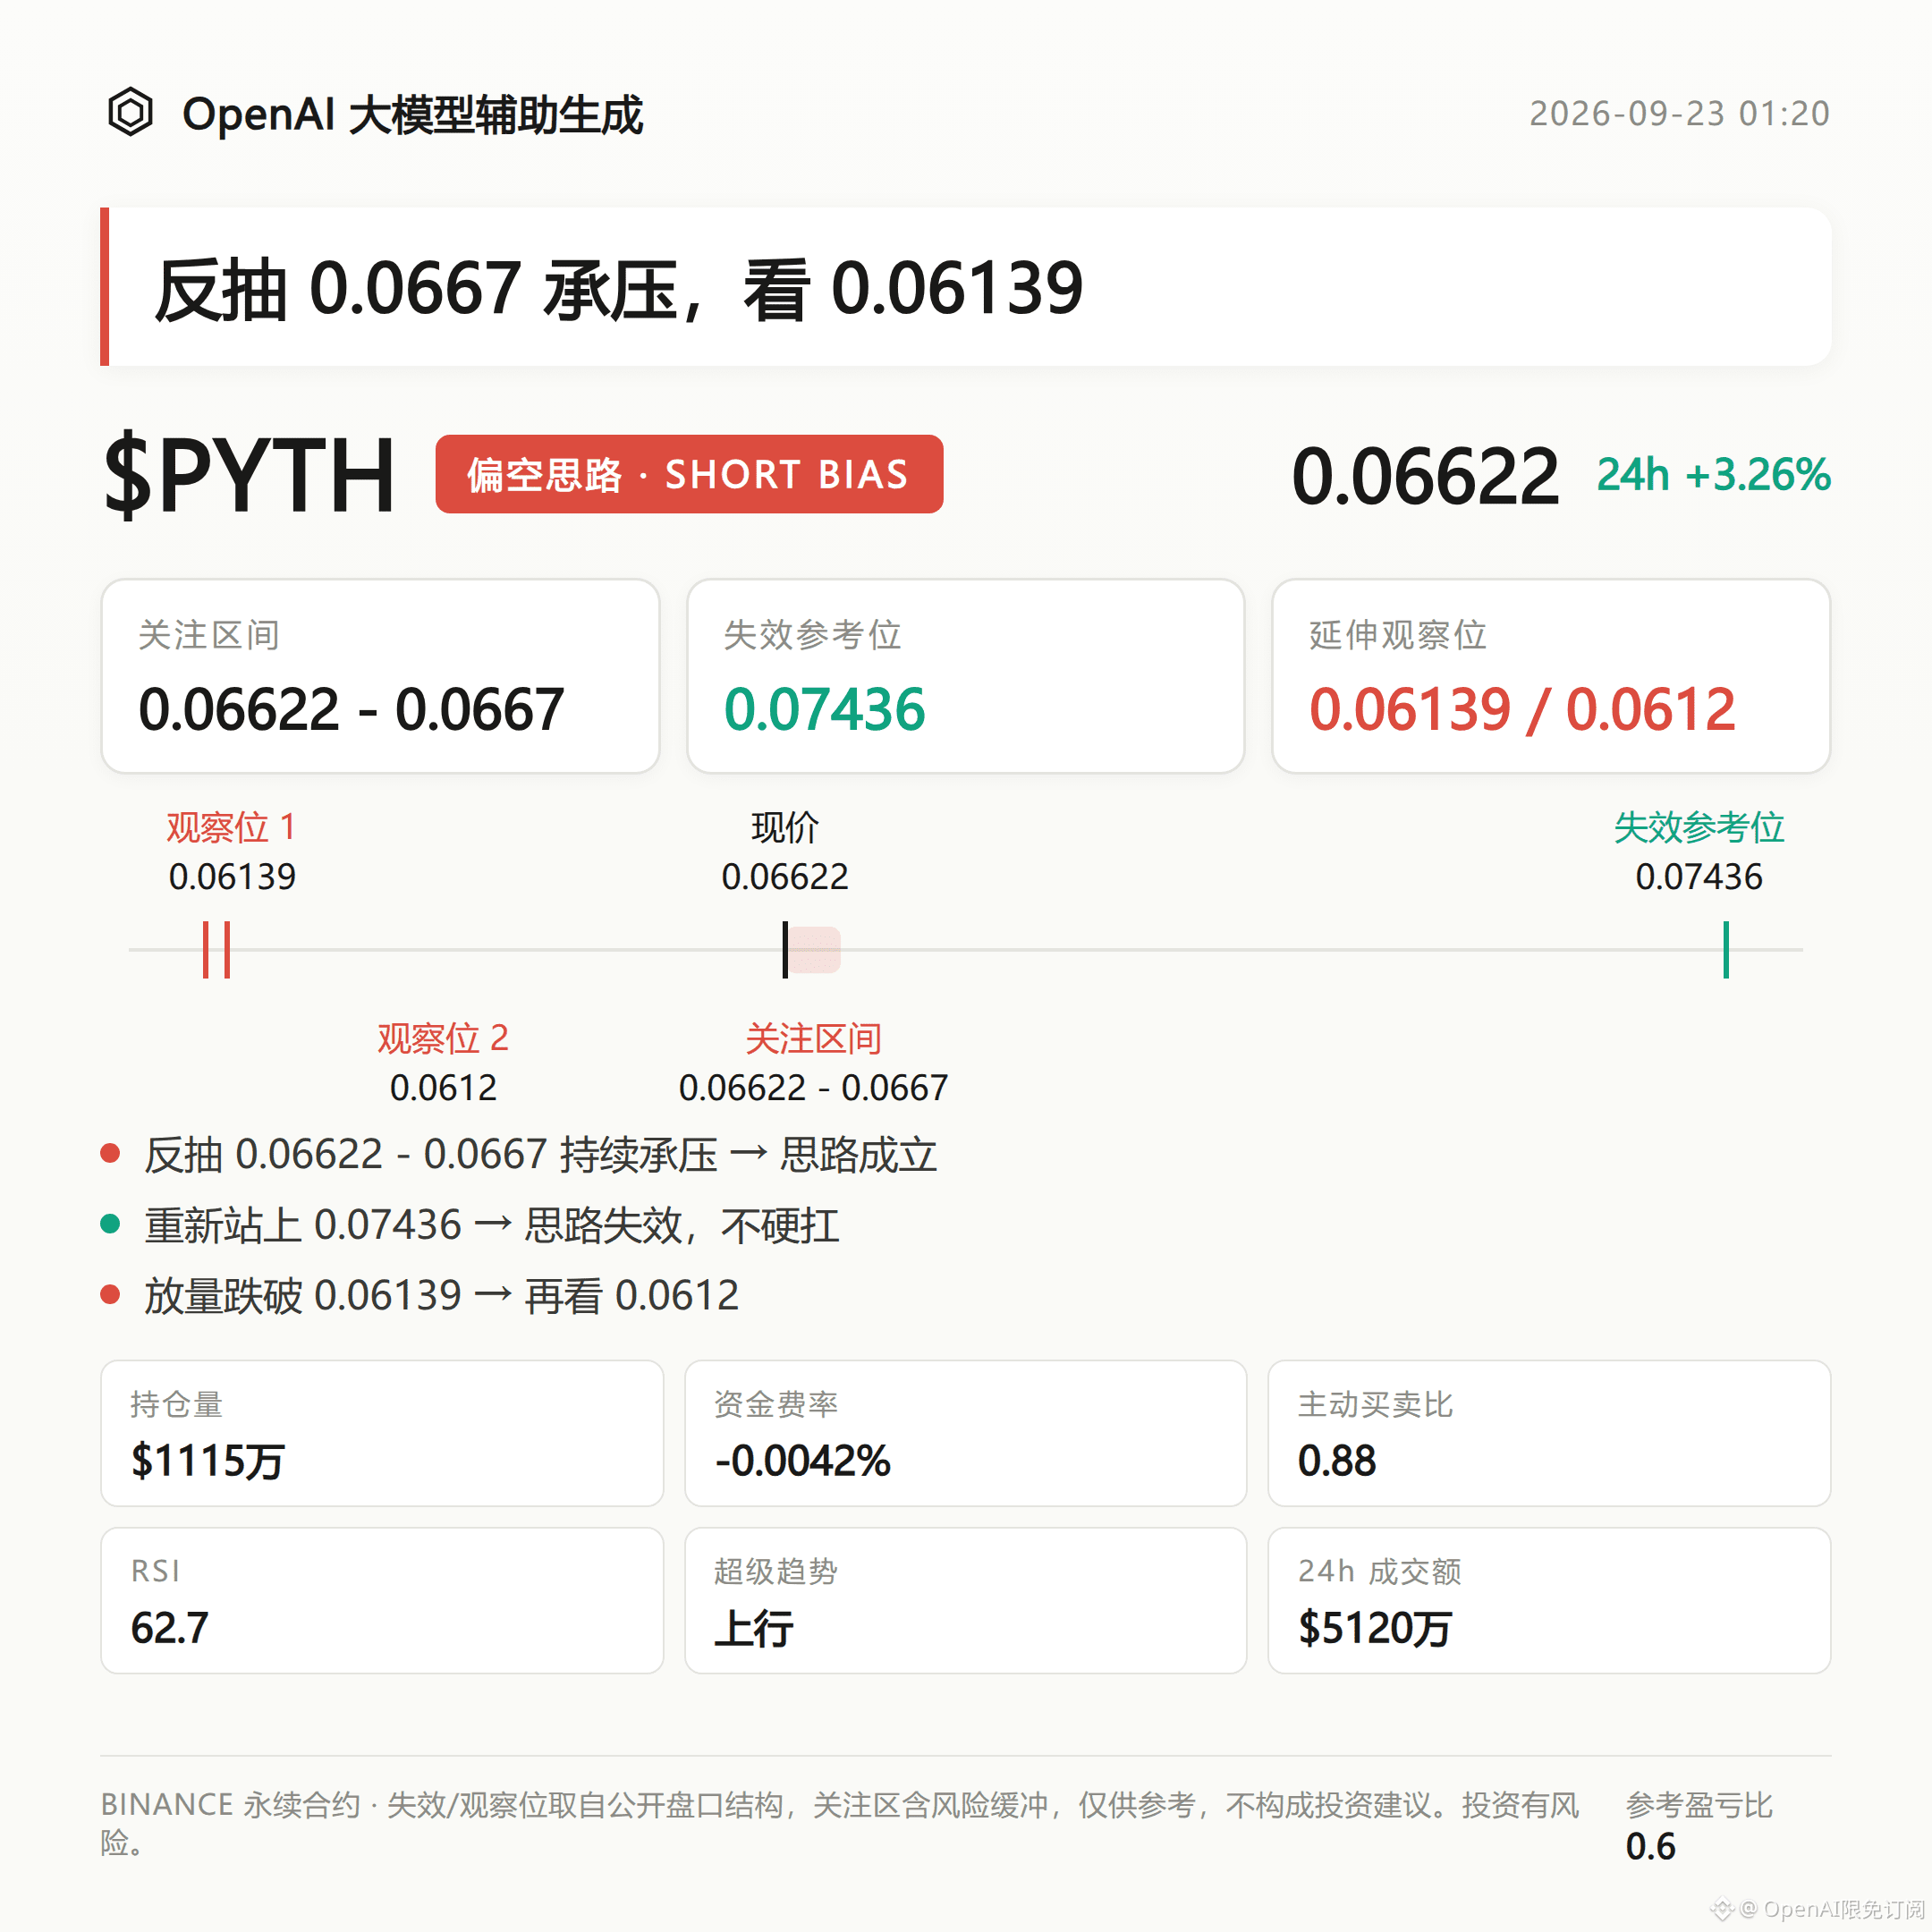
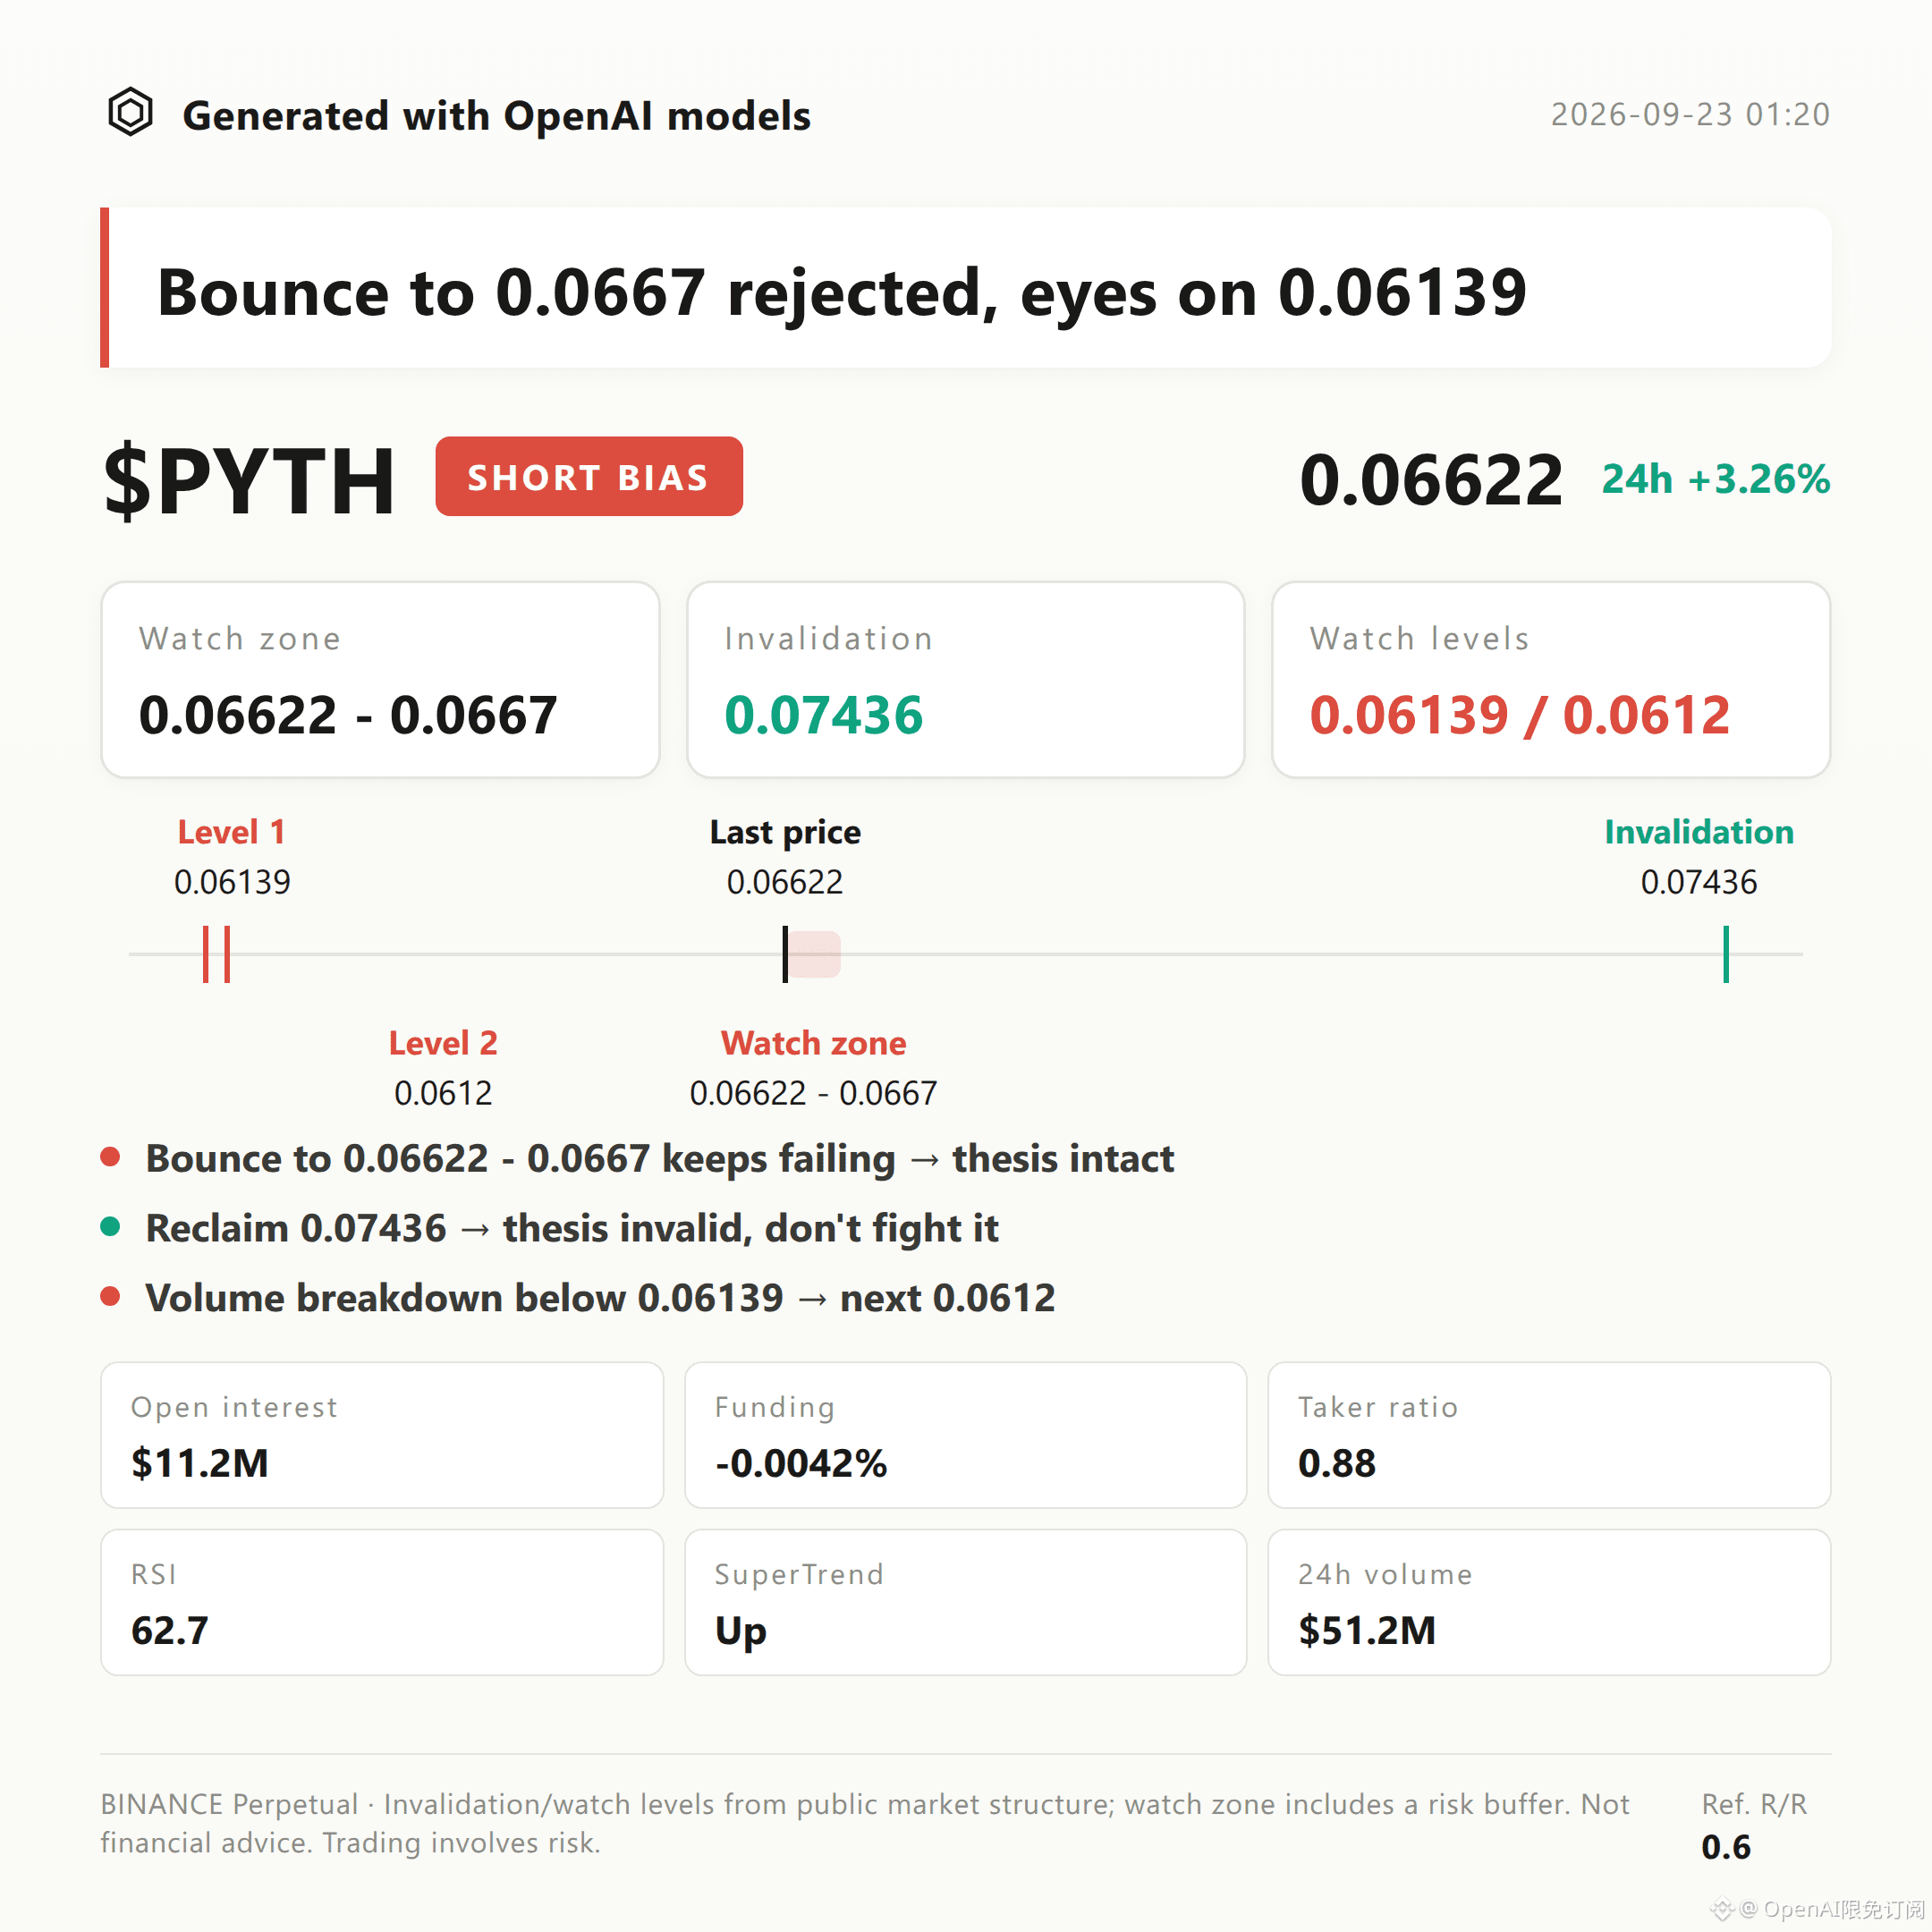
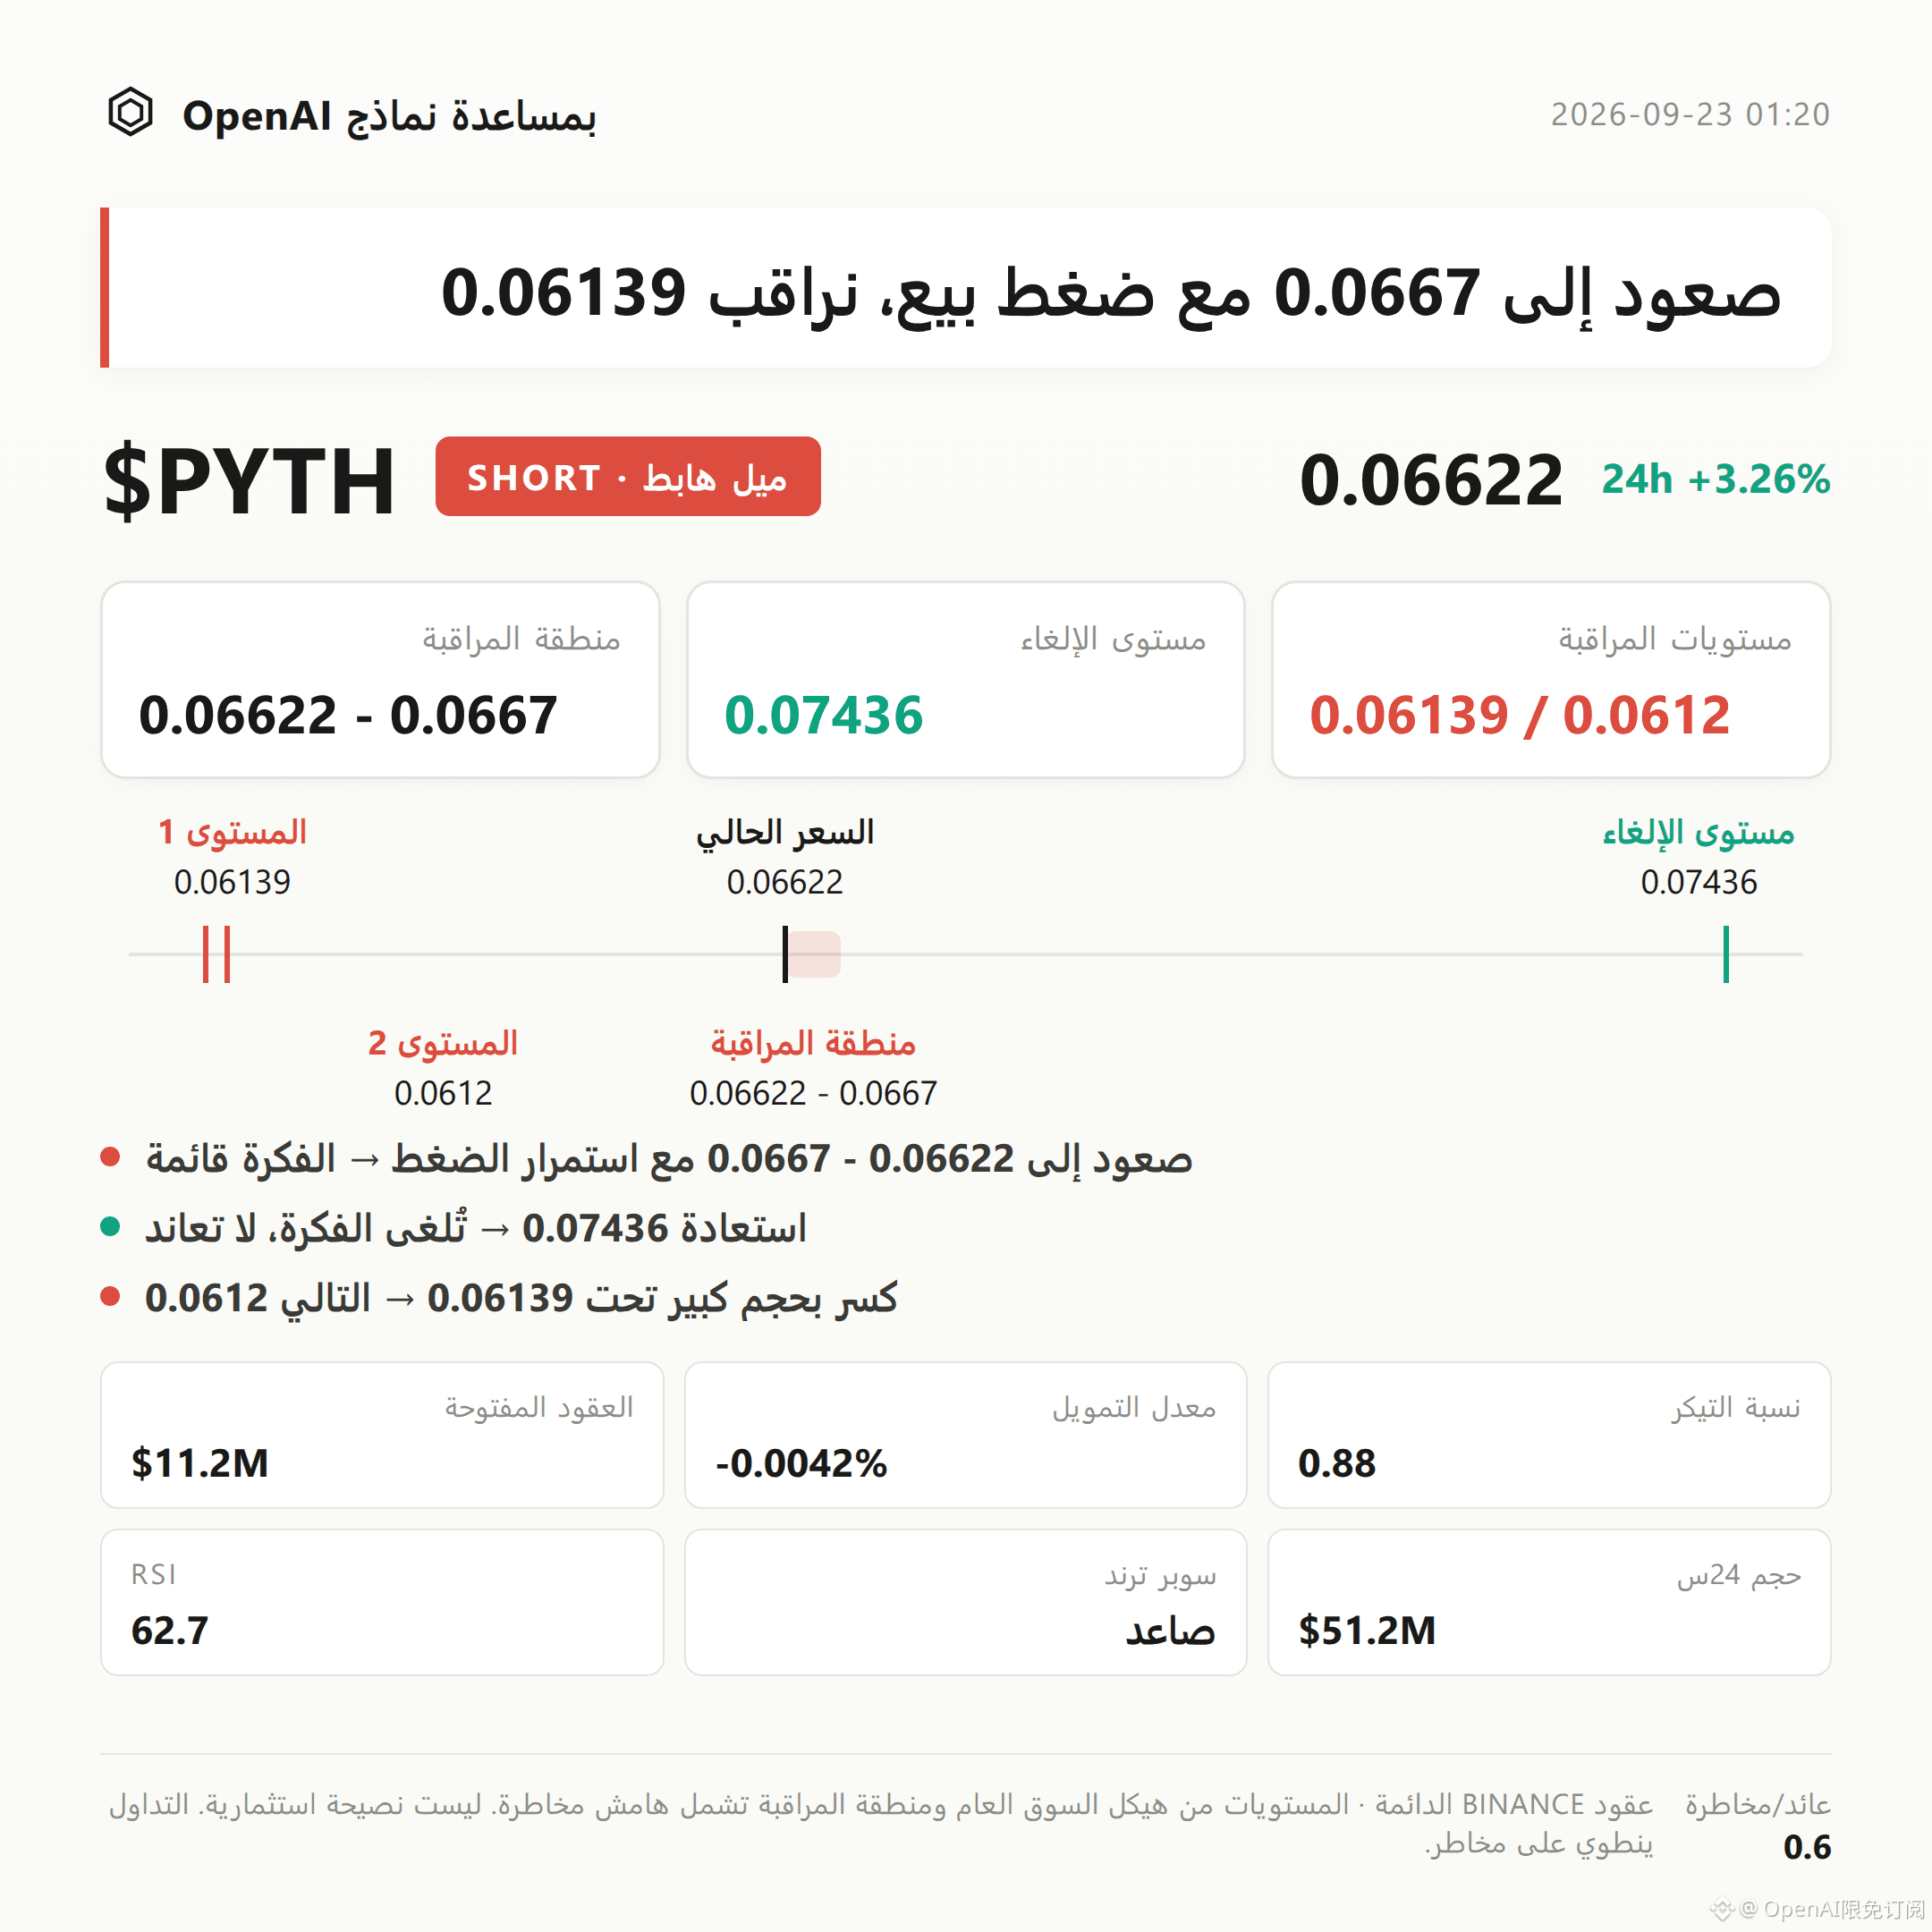
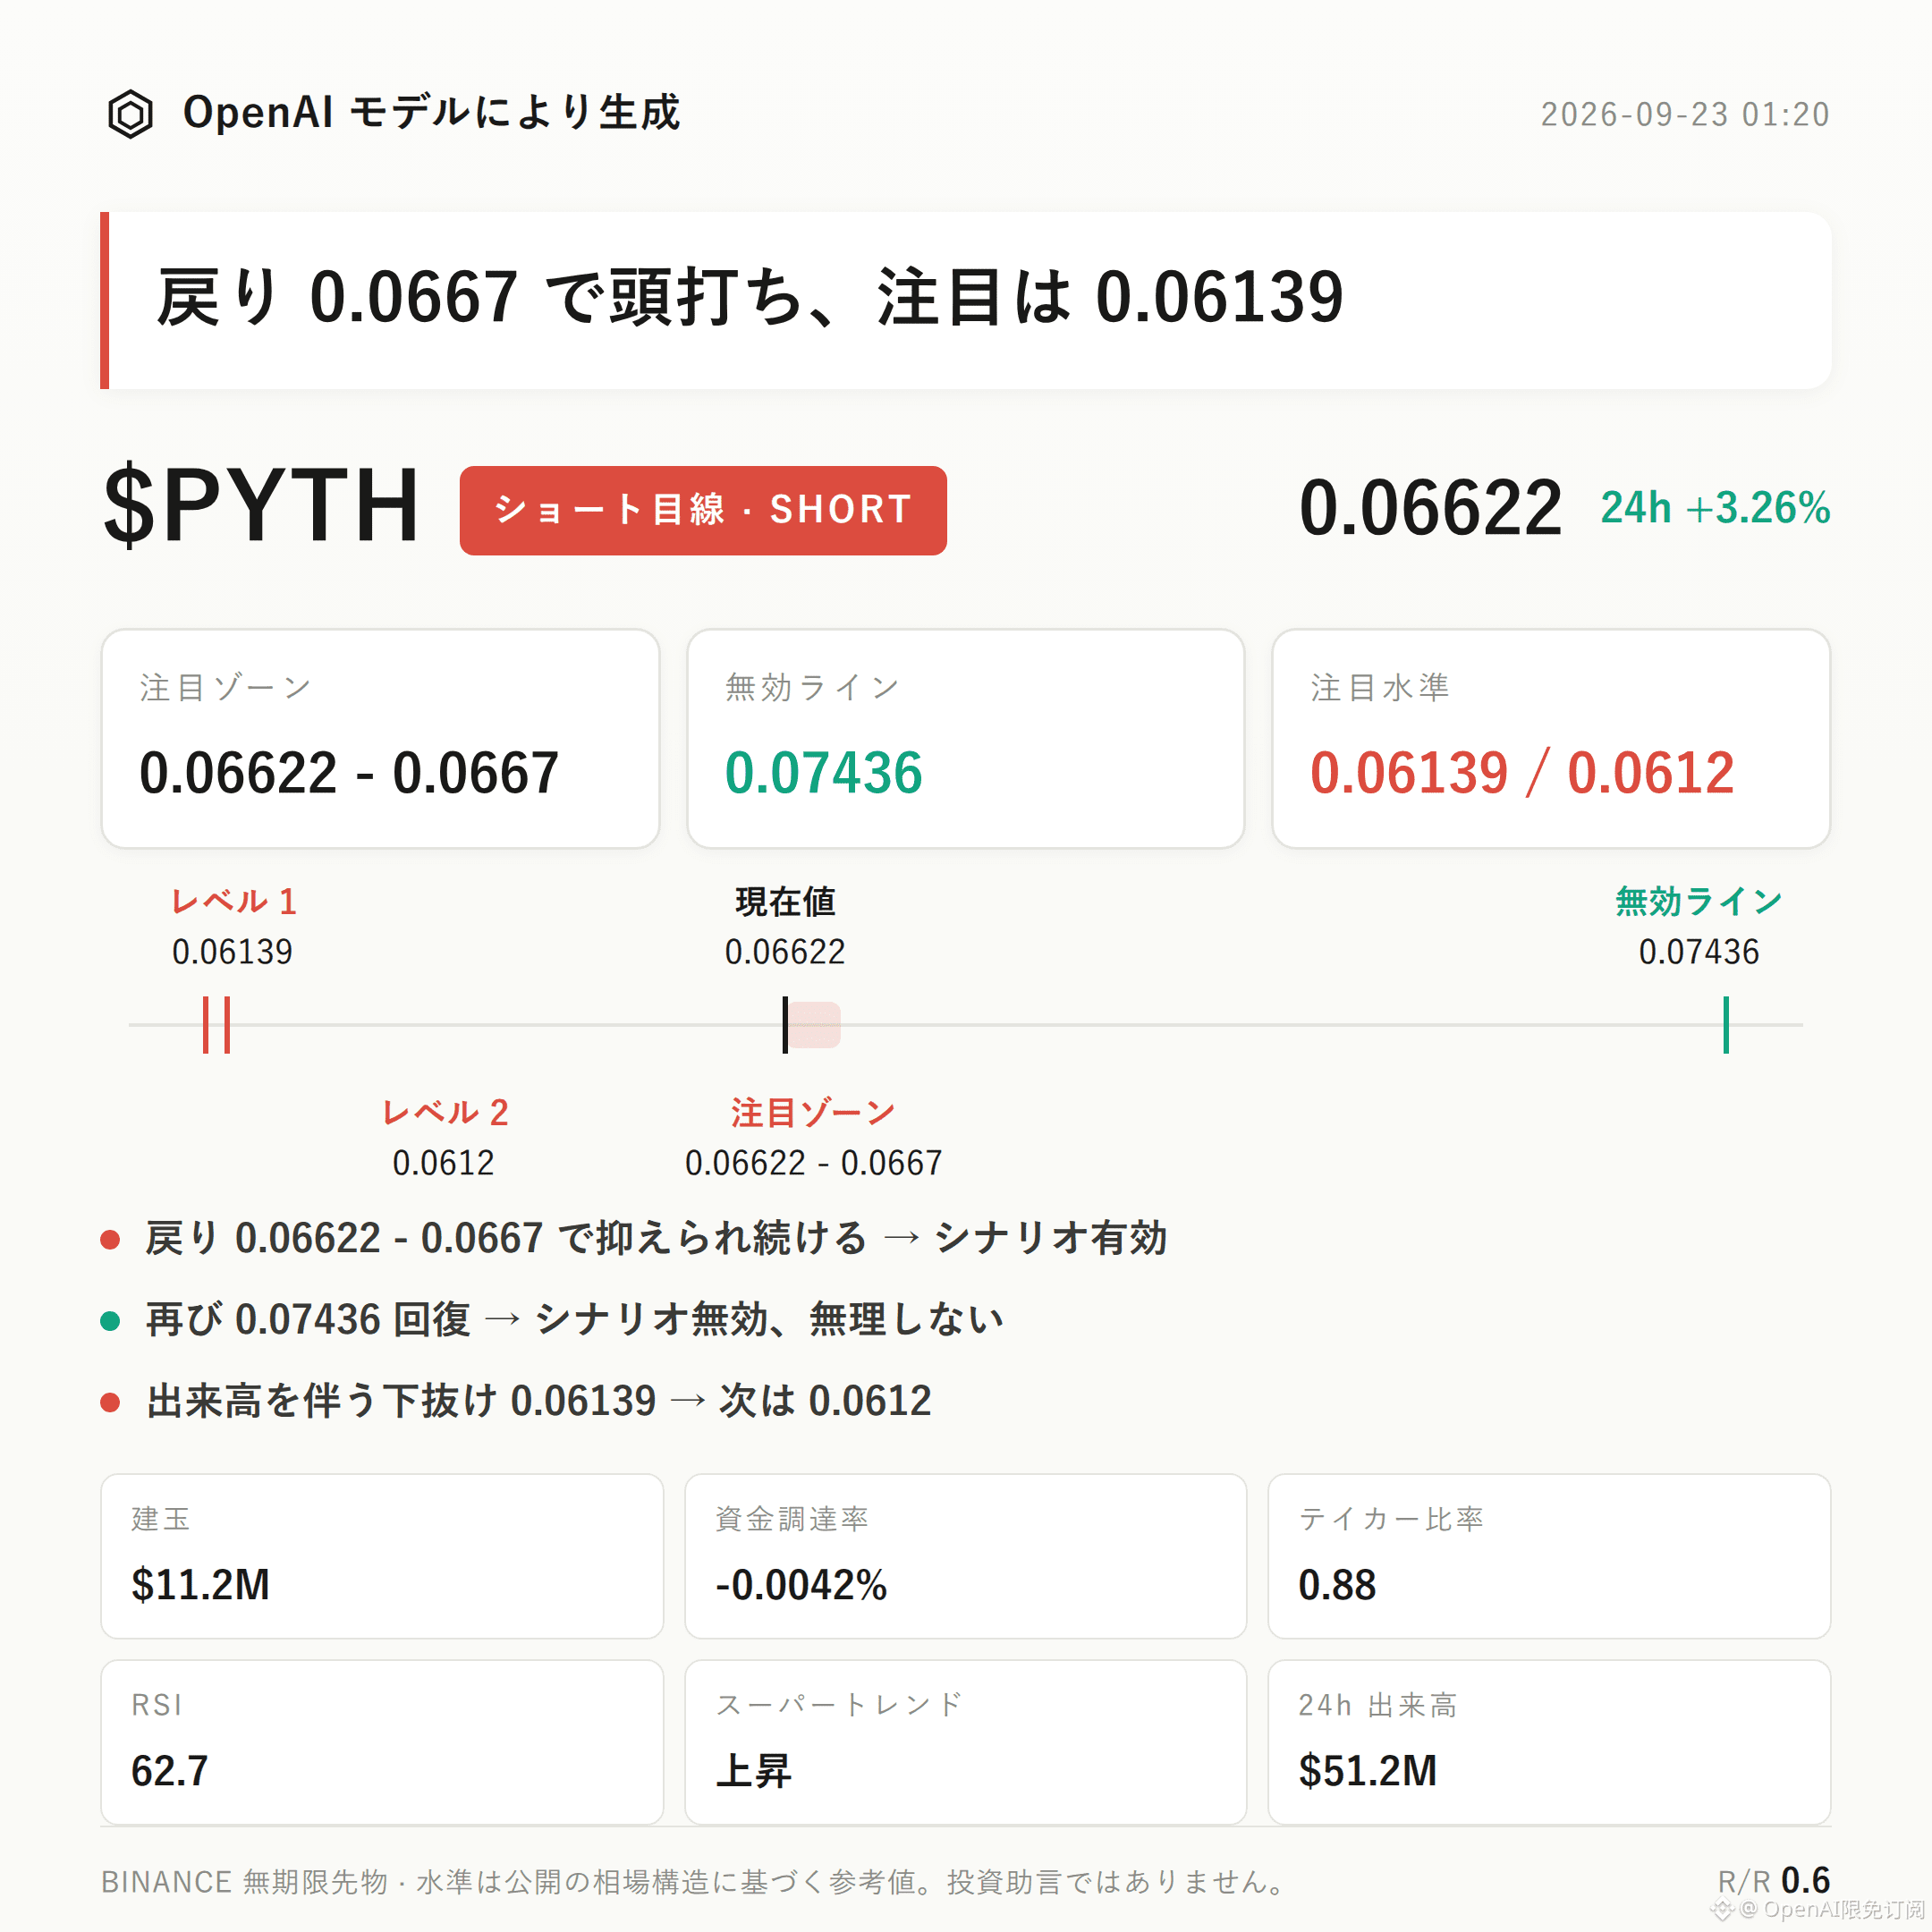
$PYTH Bearish Bias | Watch Zone 0.06622 - 0.0667 | Invalidation Reference 0.07436 | Observation Levels 0.06139 / 0.0612
$PYTH ’s current structure is leaning bearish.
Core arguments: sustained dominance of sell orders in the market (active buy/sell ratio 0.88), funding rate has turned negative (-0.0042%), and the price is still within a pullback range below the recent high at 0.07436—these three together suggest downward pressure from above.
The focus is whether a rebound can be capped again within 0.06622–0.0667. If it gets capped, the pullback structure may continue. If there is a valid breakout, the situation needs to be reassessed.
From a technical structure perspective, the current price at 0.06622 is close to the upper Bollinger Band at 0.0667 (middle band 0.0639, lower band 0.0612), moving along the upper edge of the channel.
The recent high at 0.07436 and the recent low at 0.06139 form the range of this current cycle’s fluctuation, and the current position is more toward the upper side of that range.
It needs to be stated plainly: RSI 62.7, MACD bullish momentum, and the SuperTrend pointing upward—all these momentum indicators are in a bullish state, not bearish signals. This is disclosed proactively here.
In derivatives data: 24h trading volume is about $51.2M, open interest about $11.15M, and 24h open interest increased by 22.9%, indicating new capital has entered.
Funding rate is negative (-0.0042%), but the long-account share is also as high as 62%, suggesting some divergence in the long/short structure.
Combined with the active buy/sell ratio of 0.88 and sell-side order dominance, these are the main reasons for the bearish bias in this post.
For key reference levels: if the price retraces to 0.06622–0.0667, and after reaching the watch zone it shows pressure again and fails to hold effectively, the bearish bias can continue to be observed.
If the price rises back above 0.07436, it would indicate that the current pullback structure has been broken, meaning the bearish bias would be invalid and should not be applied further.
If price breaks down below 0.06139 on increased volume, then watch whether support near 0.0612 can take over. If it breaks and cannot be absorbed, the downside observation space may open further.
Need to be stated accurately: besides the active buy/sell ratio, there are no other notable opposing signals in this dataset. Also, the 24h rise/fall is still +3.26%, and RSI, MACD, and SuperTrend are all in a bullish-leaning state. There is no clear deterioration in market sentiment. This background is important when assessing a bearish bias.
The参考盈亏比 (risk-reward ratio) is about 0.6, which is on the low side—so even if the directional structure judgment is correct, the upside/downside potential is limited.
With contract leverage, position discipline is more important than directional judgment.
For reference only; not investment advice. Contracts are leveraged; investing involves risk.
This article was generated with assistance from an OpenAI model.
$PYTH
#Contract Analysis
$PYTH Bearish Bias | Watch Zone 0.06622 - 0.0667 | Invalidation Reference 0.07436 | Observation Levels 0.06139 / 0.0612
$PYTH ’s current structure is leaning bearish.
Core arguments: sustained dominance of sell orders in the market (active buy/sell ratio 0.88), funding rate has turned negative (-0.0042%), and the price is still within a pullback range below the recent high at 0.07436—these three together suggest downward pressure from above.
The focus is whether a rebound can be capped again within 0.06622–0.0667. If it gets capped, the pullback structure may continue. If there is a valid breakout, the situation needs to be reassessed.
From a technical structure perspective, the current price at 0.06622 is close to the upper Bollinger Band at 0.0667 (middle band 0.0639, lower band 0.0612), moving along the upper edge of the channel.
The recent high at 0.07436 and the recent low at 0.06139 form the range of this current cycle’s fluctuation, and the current position is more toward the upper side of that range.
It needs to be stated plainly: RSI 62.7, MACD bullish momentum, and the SuperTrend pointing upward—all these momentum indicators are in a bullish state, not bearish signals. This is disclosed proactively here.
In derivatives data: 24h trading volume is about $51.2M, open interest about $11.15M, and 24h open interest increased by 22.9%, indicating new capital has entered.
Funding rate is negative (-0.0042%), but the long-account share is also as high as 62%, suggesting some divergence in the long/short structure.
Combined with the active buy/sell ratio of 0.88 and sell-side order dominance, these are the main reasons for the bearish bias in this post.
For key reference levels: if the price retraces to 0.06622–0.0667, and after reaching the watch zone it shows pressure again and fails to hold effectively, the bearish bias can continue to be observed.
If the price rises back above 0.07436, it would indicate that the current pullback structure has been broken, meaning the bearish bias would be invalid and should not be applied further.
If price breaks down below 0.06139 on increased volume, then watch whether support near 0.0612 can take over. If it breaks and cannot be absorbed, the downside observation space may open further.
Need to be stated accurately: besides the active buy/sell ratio, there are no other notable opposing signals in this dataset. Also, the 24h rise/fall is still +3.26%, and RSI, MACD, and SuperTrend are all in a bullish-leaning state. There is no clear deterioration in market sentiment. This background is important when assessing a bearish bias.
The参考盈亏比 (risk-reward ratio) is about 0.6, which is on the low side—so even if the directional structure judgment is correct, the upside/downside potential is limited.
With contract leverage, position discipline is more important than directional judgment.
For reference only; not investment advice. Contracts are leveraged; investing involves risk.
This article was generated with assistance from an OpenAI model.
$PYTH
#Contract Analysis