📉 $SUI Pullback After Hitting $1.08! Good Dip to Buy or Bear Trap? 🧐
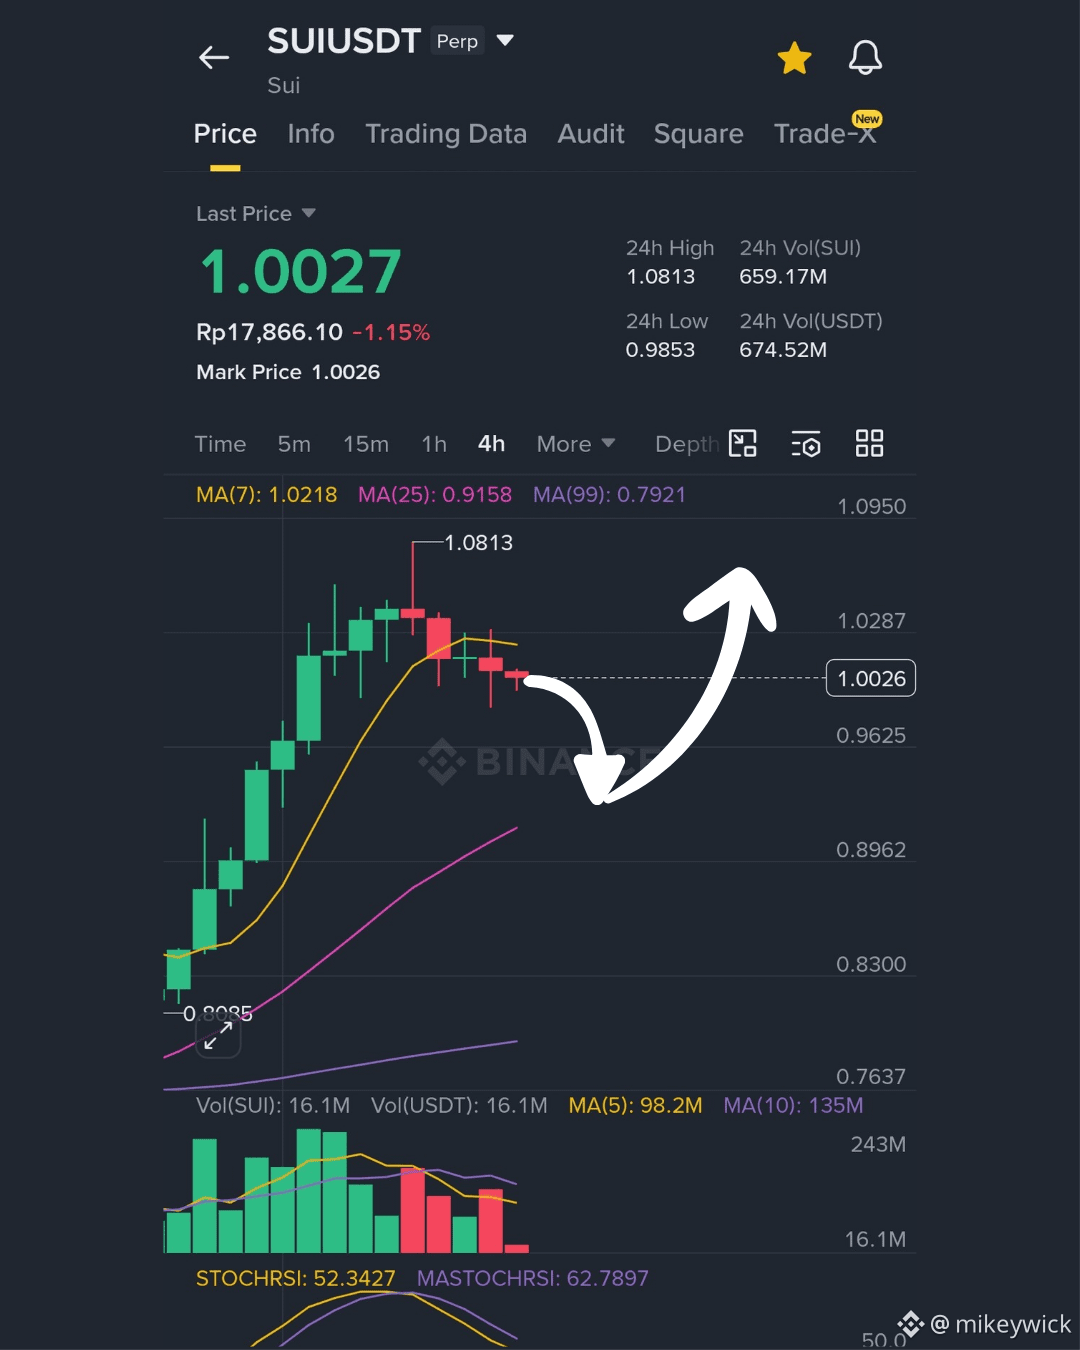
If we take a look at the $SUI/USDT 4-hour chart, after briefly surging to a high of $1.0813, the price is currently undergoing a healthy correction to around $1.0026
A series of red candles, combined with a downward-trending Stoch RSI indicator, suggests that buyers are taking a brief pause and allowing the price to retest the nearest MA area.
Instead of giving in to FOMO or panic selling, let’s look at the key support levels and wait for confirmation of a bounce!
SUI/USDT
Entry Plan : BUY/LONG
Entry : 0.9620 – 0.9850 (Wait for retest to support MA25)
TP 1 : 1.0280
TP 2 : 1.0810
TP 3 : 1.1500
SL : 0.9150
Analysis :
1.Short-Term Trend: The 4-hour chart is currently in a short-term downtrend/correction (Stoch RSI in the oversold zone).
2. Major Trend: In the broader trend, the price remains above the 25-period MA (0.9150) and the 99-period MA (0.7921), so the bullish structure has not yet completely broken down.
Trade $SUI 👇
If we take a look at the $SUI/USDT 4-hour chart, after briefly surging to a high of $1.0813, the price is currently undergoing a healthy correction to around $1.0026
A series of red candles, combined with a downward-trending Stoch RSI indicator, suggests that buyers are taking a brief pause and allowing the price to retest the nearest MA area.
Instead of giving in to FOMO or panic selling, let’s look at the key support levels and wait for confirmation of a bounce!
SUI/USDT
Entry Plan : BUY/LONG
Entry : 0.9620 – 0.9850 (Wait for retest to support MA25)
TP 1 : 1.0280
TP 2 : 1.0810
TP 3 : 1.1500
SL : 0.9150
Analysis :
1.Short-Term Trend: The 4-hour chart is currently in a short-term downtrend/correction (Stoch RSI in the oversold zone).
2. Major Trend: In the broader trend, the price remains above the 25-period MA (0.9150) and the 99-period MA (0.7921), so the bullish structure has not yet completely broken down.
Trade $SUI 👇