


On September 19, Rayls published a post (“Privacy has a price”). The title said “honest math,” but the entire piece only provided a single range of numbers: a proof takes anywhere from a few hundred milliseconds to a few seconds. For weeks I kept writing about Rayls’ privacy architecture; this time I’m sharing the new stuff with everyone. I pulled down the publicly released proof code, ran it dozens of times in practice, and I’m sharing this interesting conclusion!
Let’s first talk about what the blog covers. Its core argument can be summarized in two sentences. The first sentence is where the cost comes from: confidential transactions are more expensive than transparent ones—mainly because generating zero-knowledge proofs is costly, while verification is relatively cheap. Even a basic confidential transfer proof takes several hundred milliseconds to a few seconds on ordinary commercial hardware. The second sentence is what you should ask: institutions shouldn’t only ask about TPS; they should ask what the throughput is under the level of privacy and auditability they actually need when facing real business workloads. The blog argues that the volume in interbank settlement isn’t large, and it falls well within what confidential settlement systems can handle.
This article does something very simple: it takes the question that the blog itself raised and asks Enygma’s public code. Everything below that says “the blog says” is the original claim; anything that says “I measured” or “I calculated” is my own results and inferences—please treat them separately.
How I measured it
A zero-knowledge proof can be understood as a mathematical credential: the payer doesn’t have to reveal balances and amounts, yet can prove to the network that the transaction is valid. The proving system Enygma uses is called Groth16. The service code that generates proofs is open-sourced in the GitHub repository rayls-sovereign-gnark-api. The README positions it as the proving interface behind Privacy Ledger and the Private Network Hub.
What I tested was the latest commit 67c4c26 on the main branch on Sept 22, 2026. Not a single line changed in the circuit or proof code. I only wrote a few extra test files to call the repository’s own proving functions. The transaction data I fed in also comes from the repository’s built-in test set: one group for k=2 and one group for k=6.
Here, k is the anonymous set size. From the circuit code, one transfer will have k participants each generate a value commitment; the sender is hidden among them, so outsiders can’t tell who paid whom. The larger k is, the deeper it hides—and the larger the circuit becomes. The repository’s built-in load testing script uses k=6.
The proving keys were generated on my local machine using the same groth16.Setup. This doesn’t affect runtime because proving time depends on the circuit structure, not on the specific key values. The repository README also states that the keys in the repository are single-party Setup development/testing artifacts, not the result of a multi-party trusted setup ceremony. Production deployment requires a separate ceremony. This is consistent with the blog’s claim that Groth16 requires a trusted setup.
The test environment is a single-core Linux virtual machine: Intel Xeon 2.1GHz, 3GB of RAM. For each tier, I generated 20 proofs consecutively, and after a few minutes I ran a complete second round of the same test.
The numbers I got
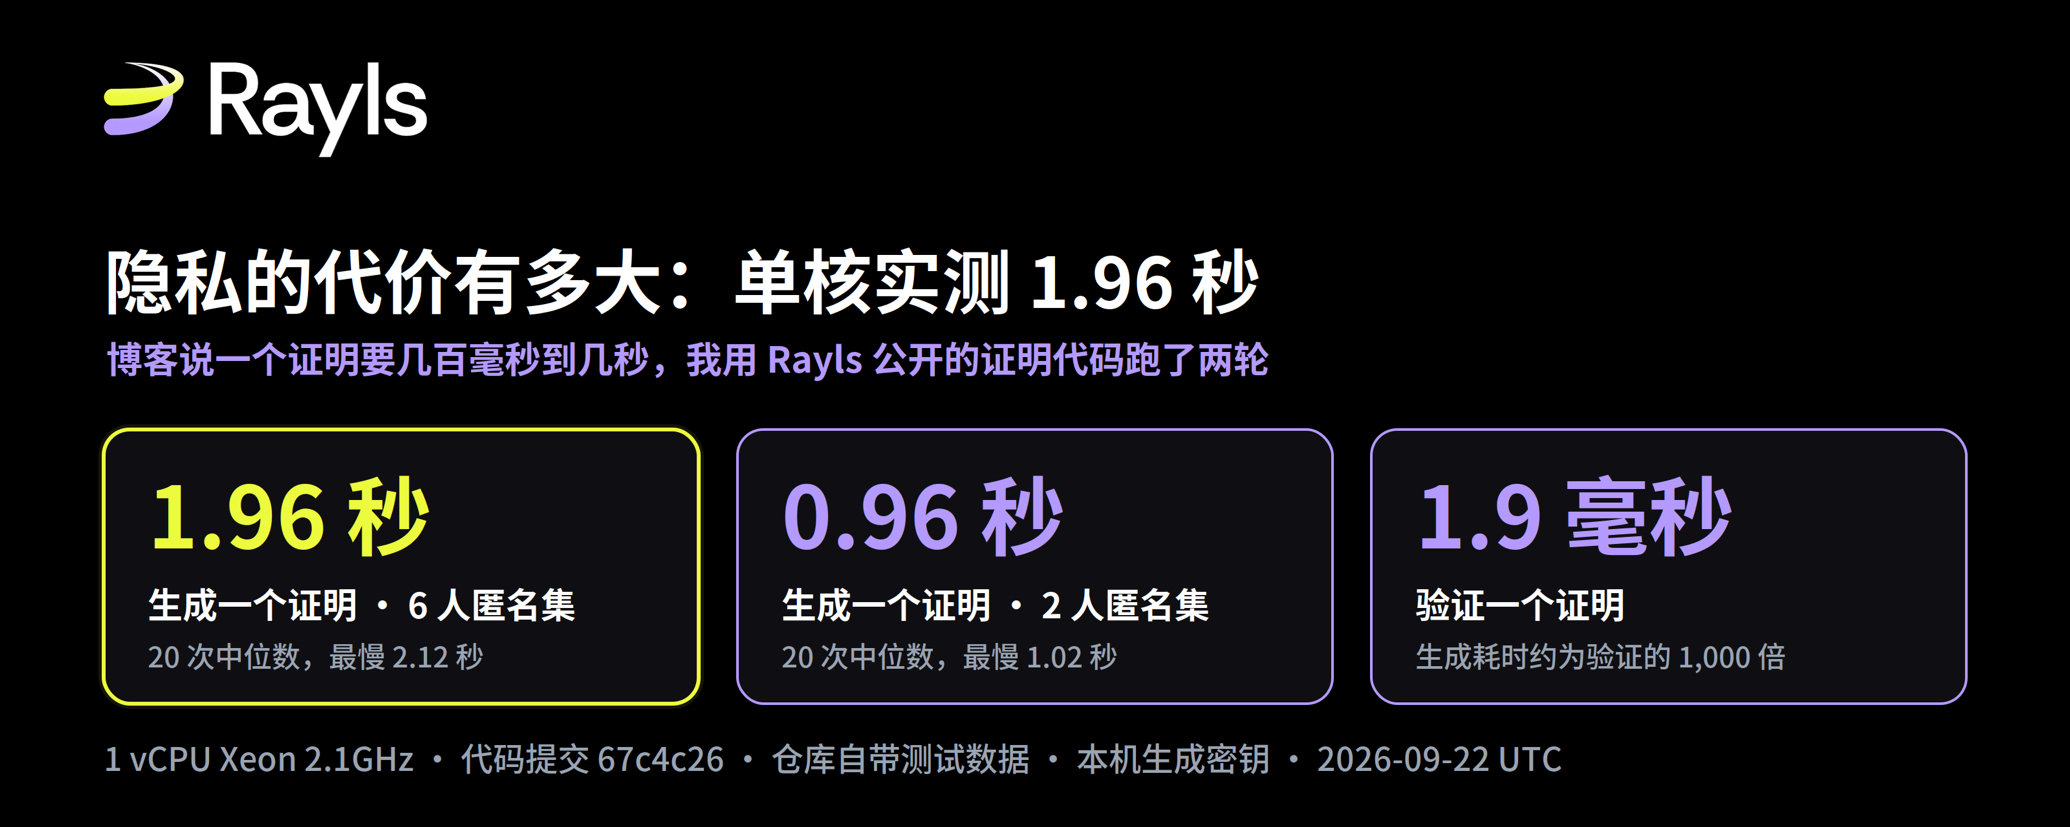
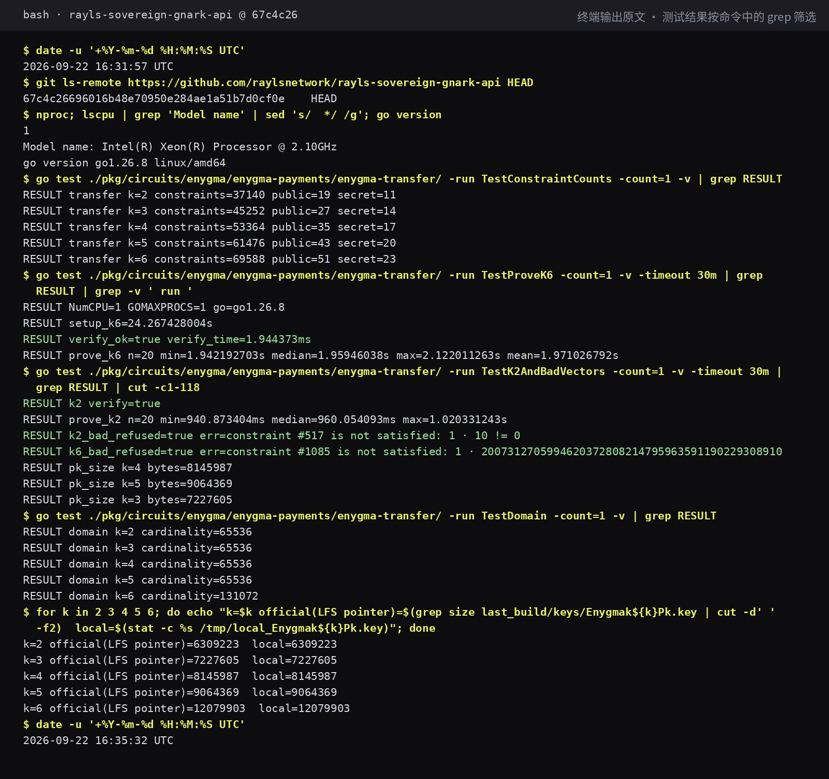
Results from the second run: for k=6 proofs, the median of 20 runs is 1.96 seconds, the fastest is 1.94 seconds, and the slowest is 2.12 seconds; for k=2, the median is 0.96 seconds. The first run had 1.97 seconds and 0.96 seconds respectively; the difference between the two runs is less than 1%. Verifying a proof takes only 1.9 milliseconds.
These numbers fall within the range given by the blog. More worth focusing on is the generation-to-verification ratio: 1.96 seconds vs 1.9 milliseconds—about 1,000:1. The blog says most time is spent on generation and verification is cheap; this ratio turns “most” into a concrete multiplier.
I also did a reverse check. The test set includes two deliberately corrupted datasets: in the k=2 set, one transfer amount was changed from 0 to 10; in the k=6 set, one hash value was tampered with. Both were rejected during the proving phase, reporting constraint failures at condition 517 and 1085 respectively, and no proofs were generated. This of course can’t prove there are no circuit vulnerabilities—it only shows that these two obvious tampering attempts get blocked.
Details not present in either blog
The first detail is circuit scale. For each additional participant, the number of constraints increases by a fixed 8,112. From k=2 (37,140) it rises in a straight line to k=6 (69,588). However, when the proving system allocates computation space to circuits, it rounds up according to powers of two. k=2 through k=5 all fit within 65,536; k=6 exceeds it by 4,052, and the computation scale jumps directly to 131,072.
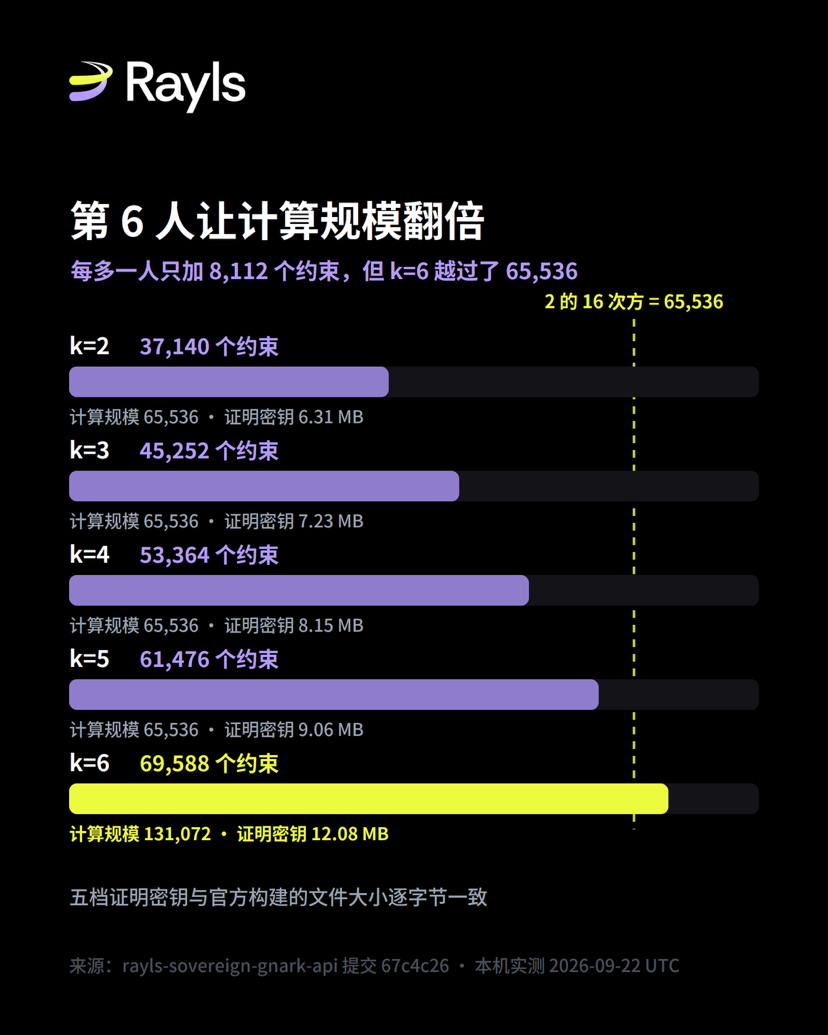 The evidence is in the file size of the proving keys. From k=2 to k=5, the key size increases steadily by 918,382 bytes per tier. But at k=6 it suddenly increases by 3,015,534 bytes—more than triple the increase of each previous tier. The direction of runtime changes matches too: from k=2 to k=6, there are about 87% more constraints and the proving time increases by 104%. How much extra time is spent just crossing that boundary separately would require transaction data from k=3 to k=5 to break it apart; the repository currently only provides k=2 and k=6 tiers, so all I can confirm now is that the direction matches. If the production environment uses k=6, it sits on the other side of this boundary; the cost of switching from k=5 to k=6 would be larger than the costs between earlier tiers. That’s my inference, not the blog’s claim.
The second detail is consistency. I generated five tiers of proving keys from the publicly available source code. Their file sizes are exactly identical byte-for-byte to the official build artifacts recorded in the repository, and the k=6 verification key is the same too. The key contents must differ because each Setup re-randomizes; but the sizes are identical, which indicates that the circuit structure compiled from the public source code matches the official build. In my previous post, when auditing Axyl, I mentioned there was a piece of history that can’t be traced between the public repository and the private version used during auditing. This time, on the proving service side, at least the part involving source code and the official build matches. Whether the official build matches production deployment is something the public materials can’t answer.
Substitute the blog’s question into real-world load
Connect to the previous section first. In that earlier post, I traced the source of several numbers in the 15,000+ TPS analysis; those numbers describe Axyl’s consensus layer. This time I’m testing another layer—namely, the proof time that each confidential transaction must spend on the sender side before sending. The numbers from these two layers can neither be added together nor substituted for each other.
The magnitude the blog cites is: for large proxy bank relationships, a few thousand transactions per day; for a central-bank-level tokenized real-time gross settlement service, tens of thousands of large value transfers per day. I replaced those with publicly available data from two existing systems. Fedwire Funds Service has 869,187 average daily transactions in 2025, and UK CHAPS has 210,483 average daily transactions for the full year 2025. These are dozens and several times the blog’s examples respectively.
Below is what I calculated, not the blog’s claims. Based on single-core verified tests, one k=6 proof takes 1.96 seconds; with one core generating at most about 44,000 proofs per day. Replacing all of Fedwire 2025’s daily average transactions with k=6 proofs would require about 473 core-hours, equivalent to 20 cores running nonstop all day. For CHAPS, it requires about 115 core-hours—less than 5 core-days. The Bank of England’s 2021 introductory materials note that CHAPS’s single-day transaction record was 320,034 on March 29, 2018, about 1.7× the daily average that year; using that peak, it still takes only about 174 core-hours.
This basis for the estimate needs to be made clear. It converts to “one core per proof.” Proofs are independent of each other, so they can be assigned to different cores and generated simultaneously. What it estimates is the transfer-proof itself. Storing, extracting, and DvP are other circuits; network transmission and on-chain settlement are also not included. Also, the blog says the proofs are generated by the sender—so the load is naturally distributed across each organization’s own nodes, not concentrated on a single machine.
So my conclusion is: the blog’s claim that interbank settlement volume is within the capability range of a confidential settlement system still holds true at real-world scale. The blog’s example uses amounts smaller than real systems; even after plugging in the real numbers, the conclusion still holds—and that actually makes the original argument more convincing than the blog’s own example. In the retail payments section, the blog itself admits that it’s the real bottleneck; these new numbers don’t change that judgment.
How should these numbers be used?
All these numbers come from single-core execution, so you can treat them as a somewhat conservative reference. The reason is in the code: when gnark generates proofs, the heaviest multi-scalar multiplication is split into multiple tasks and computed concurrently according to the machine’s number of CPU cores (directly reading runtime.NumCPU() in backend/groth16/bn254/prove.go). Typical institutional servers are multi-core; for the same proof, it gets distributed across more cores, so runtime will be lower than these single-core results. How much faster it can be depends on the number of cores and single-core performance.
The measurement scope of this article is the proof generation itself for the transfer circuit. In a complete HTTP service call chain there are also JSON parsing and network overhead. Storing, extracting, and DvP are other types of circuits.
My view
The blog’s title is “honest math,” but the numbers in the body are only given as a range. After running this, the range checks out, and the conclusion about the interbank settlement portion also holds up.
What I’d really like to see is the next step. Axyl’s benchmark page specifies conditions such as a four-node committee and 512-byte transactions. Enygma’s proof performance deserves the same treatment: when publishing the next numbers, specify the k value and hardware configuration, so institutions can reproduce results themselves like I did. This is exactly the kind of performance claim that stands up to production validation that the blog ends with. Reproducing it isn’t hard—the commands in the screenshot are the full steps.
Reference sources: Rayls official blog (Privacy has a price: the honest math behind confidential settlement at scale) (dated Sept 19, 2026); GitHub raylsnetwork/rayls-sovereign-gnark-api, commit 67c4c26 (read and tested on Sept 22, 2026); Fedwire Funds Service annual statistics (updated Jan 26, 2026); Bank of England Payment and settlement statistics and (A brief introduction to RTGS and CHAPS) (2021 edition).