🔥 Where is Bitcoin headed? Heatmap Analysis of Liquidations (24h) 🚀
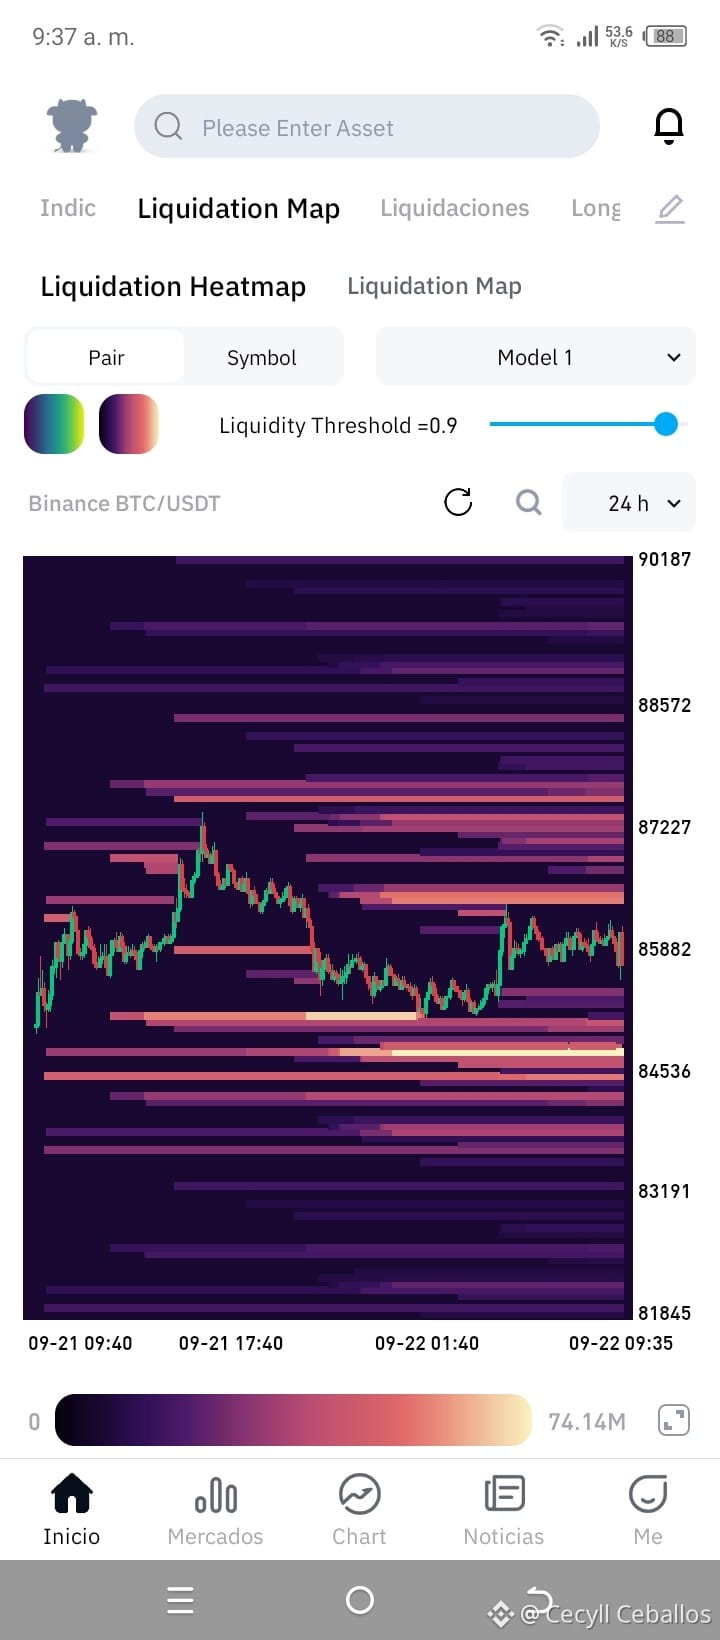
When analyzing the BTC/USDT Liquidation Heatmap on Binance (24-hour window), we can see key liquidity zones that the price could go to seek very soon.
📊 Key points from the chart:
Top Zone (Resistance / Shorts' Liq.): A dense block of bright liquidity is visible in the $87,200 – $88,500 range. If the market takes bullish momentum, this level will act as a "magnet" to sweep the short positions set up there.
Bottom Zone (Support / Longs' Liq.): At the bottom, the band of $84,500 – $84,800 shows a significant accumulation of yellow / light-yellow liquidity. The price recently tested the lower zone before bouncing back toward the middle zone (~$85,800).
Current Consolidation: Currently, Bitcoin is trading stuck in a sideways range near $85,880, compressing volatility between the two major liquidity bands.
💡 Trading Scenario:
Bullish Scenario: If it breaks strongly above $86,500, we could see a rapid acceleration toward the $87,200 - $88,500 band to sweep shorts.
Bearish Scenario: If it loses the immediate support of $85,500, there is a high risk of a sweep toward the trapped liquidity near $84,500.
💬 Community, what’s your take? Do we clean up above or below first?
👍 If you like my analysis, hit a LIKE!
🔄 If you follow me, I’ll follow you back!
#Bitcoin #BTC $BTC #Solana $SOL #Pepe $PEPE #Crypto #Trading #BinanceSquare
When analyzing the BTC/USDT Liquidation Heatmap on Binance (24-hour window), we can see key liquidity zones that the price could go to seek very soon.
📊 Key points from the chart:
Top Zone (Resistance / Shorts' Liq.): A dense block of bright liquidity is visible in the $87,200 – $88,500 range. If the market takes bullish momentum, this level will act as a "magnet" to sweep the short positions set up there.
Bottom Zone (Support / Longs' Liq.): At the bottom, the band of $84,500 – $84,800 shows a significant accumulation of yellow / light-yellow liquidity. The price recently tested the lower zone before bouncing back toward the middle zone (~$85,800).
Current Consolidation: Currently, Bitcoin is trading stuck in a sideways range near $85,880, compressing volatility between the two major liquidity bands.
💡 Trading Scenario:
Bullish Scenario: If it breaks strongly above $86,500, we could see a rapid acceleration toward the $87,200 - $88,500 band to sweep shorts.
Bearish Scenario: If it loses the immediate support of $85,500, there is a high risk of a sweep toward the trapped liquidity near $84,500.
💬 Community, what’s your take? Do we clean up above or below first?
👍 If you like my analysis, hit a LIKE!
🔄 If you follow me, I’ll follow you back!
#Bitcoin #BTC $BTC #Solana $SOL #Pepe $PEPE #Crypto #Trading #BinanceSquare