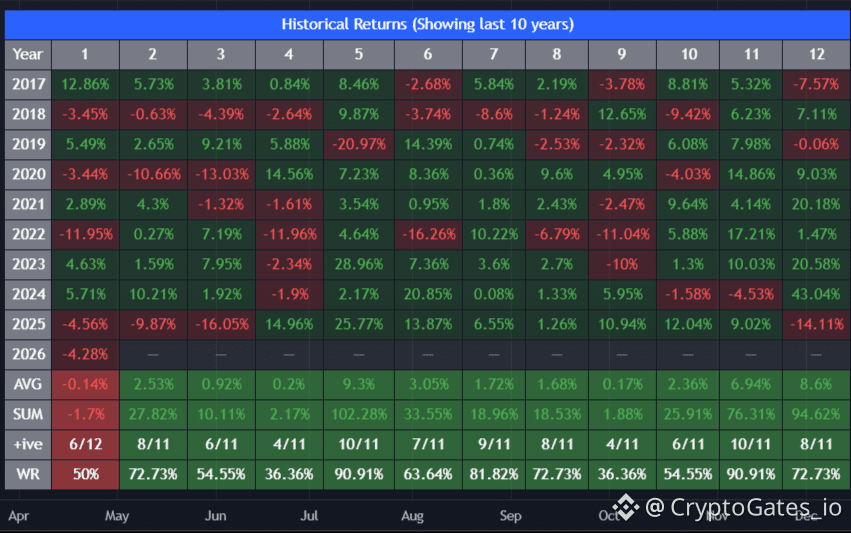
$BTC Seasonality: The September vs. November Gap
A decade of BTC monthly return data shows a clear historical divergence. September has closed positive in only 4 of the last 11 years, averaging just 0.17% return, the weakest win rate of any month. November tells the opposite story: 10 of 11 years positive, averaging 6.94%.
2026 has already shown why this data should be read as context and not prediction. January closed at -4.28%, sharper than the historical January average of -0.14%.
seasonality patterns are useful reference points, but they are not entry signals on their own. Position sizing, liquidity conditions, and a tested strategy still matter more than which month is on the calendar.
Verify first. Risk later. Scale slowly...
#BitcoinSeasonality #BSquare
A decade of BTC monthly return data shows a clear historical divergence. September has closed positive in only 4 of the last 11 years, averaging just 0.17% return, the weakest win rate of any month. November tells the opposite story: 10 of 11 years positive, averaging 6.94%.
2026 has already shown why this data should be read as context and not prediction. January closed at -4.28%, sharper than the historical January average of -0.14%.
seasonality patterns are useful reference points, but they are not entry signals on their own. Position sizing, liquidity conditions, and a tested strategy still matter more than which month is on the calendar.
Verify first. Risk later. Scale slowly...
#BitcoinSeasonality #BSquare