$ZEC Don’t rush to chase this wave! Around 1560, the real long/short life-and-death line has surfaced
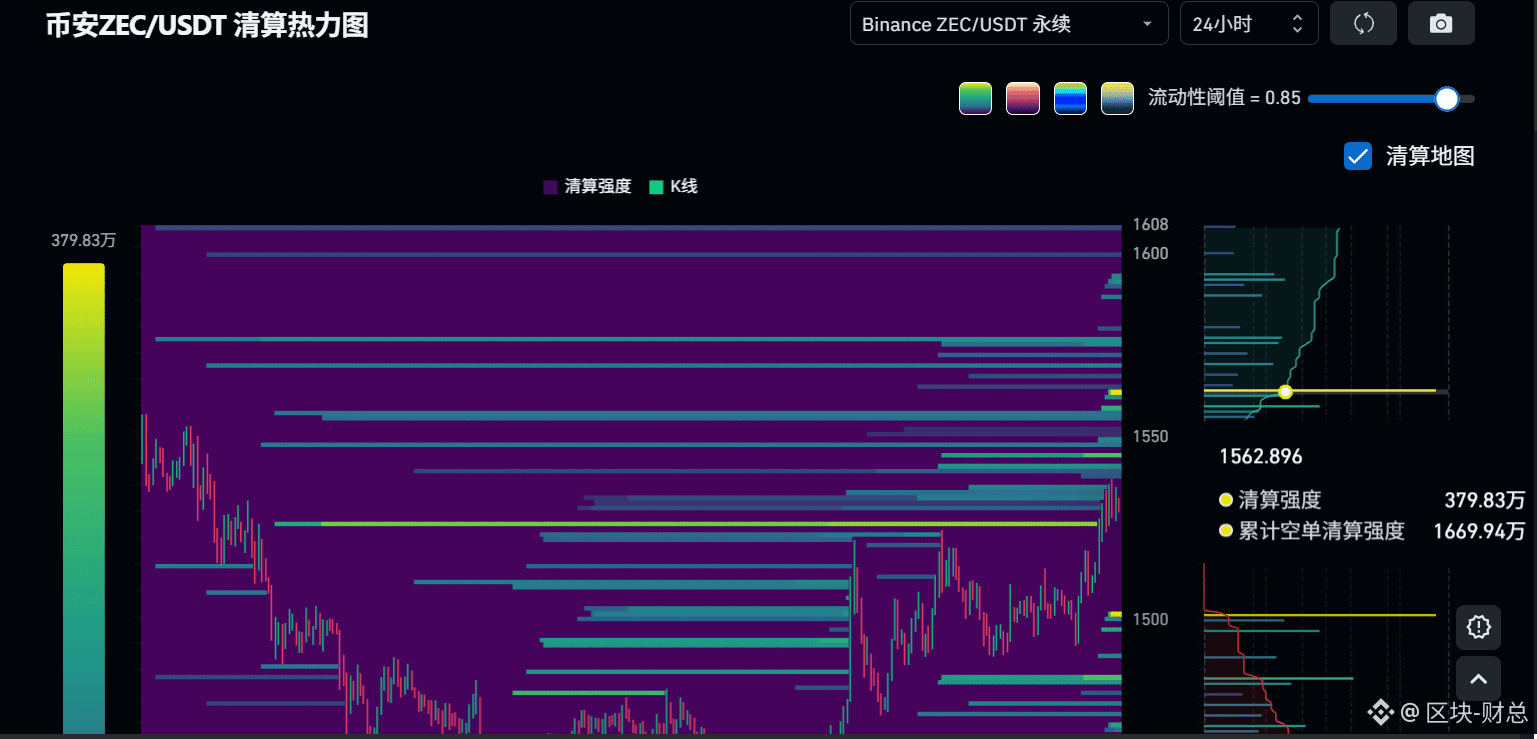
Brothers, when I look at this liquidation heatmap of $ZEC , what I care about isn’t how much it has risen, but which side’s liquidity—above or below—gets eaten first.
From the chart, after ZEC goes through a round of fast pumping, the price has returned to the 1550–1565 area. Here, you can clearly see a layer of stronger liquidation liquidity stacked up. Above that, in the 1580–1600 zone, there are also continuous liquidity bands.
My trading logic is simple: don’t blindly chase near 1560.
If the price holds and stands firmly above 1560 on volume, then breaks through toward 1580, the next battle area is likely around 1600. But if repeated attempts near 1560 fail—while below, around 1540 and 1500, liquidity starts getting absorbed quickly—then you need to be on guard for a pullback.
I trade ZEC, and I’ve never said “buy” just because there’s one big bullish candle, nor “sell” just because two red candles show up.
What’s actually worth doing is waiting for liquidity to get triggered, then watching how price moves.
This is exactly what I value most when I manage the market: first find liquidity, then wait for confirmation, and only then take action.
Recently, ZEC’s volatility has been extremely high. On September 16, the daily gain exceeded 20%, and then it clearly entered a choppy consolidation again. That means this is absolutely not a good spot to blindly chase or blindly fight.
So next, I’m only watching one thing: whether a real breakout happens above 1560, or whether it’s another “bull trap.”
Once this position gives confirmation, the trading space for what comes next is completely different.
I’ve already locked in the key levels.
As for the real entry point—I won’t spell it out in advance. Those who understand will understand.
If you want to see how I break down this ZEC move, you can follow @区块-财总 . Let’s talk again once the signal shows up!!
#币圈起伏落袋为安
#小白必看
#分析行情
Brothers, when I look at this liquidation heatmap of $ZEC , what I care about isn’t how much it has risen, but which side’s liquidity—above or below—gets eaten first.
From the chart, after ZEC goes through a round of fast pumping, the price has returned to the 1550–1565 area. Here, you can clearly see a layer of stronger liquidation liquidity stacked up. Above that, in the 1580–1600 zone, there are also continuous liquidity bands.
My trading logic is simple: don’t blindly chase near 1560.
If the price holds and stands firmly above 1560 on volume, then breaks through toward 1580, the next battle area is likely around 1600. But if repeated attempts near 1560 fail—while below, around 1540 and 1500, liquidity starts getting absorbed quickly—then you need to be on guard for a pullback.
I trade ZEC, and I’ve never said “buy” just because there’s one big bullish candle, nor “sell” just because two red candles show up.
What’s actually worth doing is waiting for liquidity to get triggered, then watching how price moves.
This is exactly what I value most when I manage the market: first find liquidity, then wait for confirmation, and only then take action.
Recently, ZEC’s volatility has been extremely high. On September 16, the daily gain exceeded 20%, and then it clearly entered a choppy consolidation again. That means this is absolutely not a good spot to blindly chase or blindly fight.
So next, I’m only watching one thing: whether a real breakout happens above 1560, or whether it’s another “bull trap.”
Once this position gives confirmation, the trading space for what comes next is completely different.
I’ve already locked in the key levels.
As for the real entry point—I won’t spell it out in advance. Those who understand will understand.
If you want to see how I break down this ZEC move, you can follow @区块-财总 . Let’s talk again once the signal shows up!!
#币圈起伏落袋为安
#小白必看
#分析行情