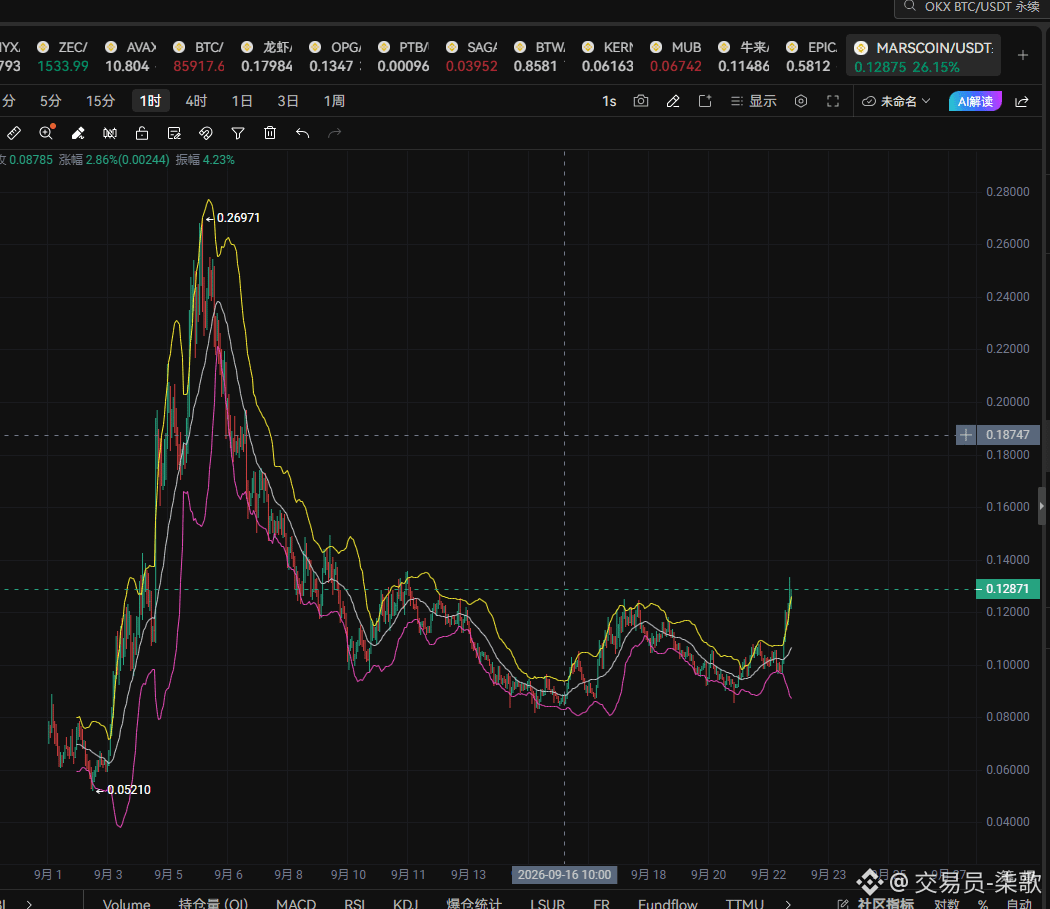
Just took a look at the chart of $MARSCOIN (Mars Coin). To be honest, the trend looks pretty fierce, but my palms are a bit sweaty.
Many people ask me whether 0.128 is worth chasing. I didn’t answer directly—I just threw these two candlestick charts at them.
👉 A typical “oversold rebound meets resistance”: Looking at the 4-hour chart, it has been drifting down from the high at 0.269 all the way—cut in half, then cut in half again—now it has rebounded to 0.128. What does this mean? It means 0.128 is exactly the bottom of the platform during the previous leg down. And the current price is right up against the “ceiling.” There’s a huge amount of trapped positions accumulated here. If the main force wants to break through, they’ll have to spend real money to liberate the people above. Do you think they’ll be so kind as to just pull straight through? Most likely, it’s a bull trap.
👉 Short-term sentiment is overheated: The 1-hour chart shows that after a sudden spike upward, the upper wicks have started to get longer. This indicates the sell pressure overhead is extremely heavy, and the bulls’ momentum is already fading. At 0.128, it looks like a reversal, but in reality it’s a risk zone for a “double top” or a continuation of the downtrend.
This is exactly the kind of “tail-end/last-temptation” market—or a bull-trap scenario. Little meat, lots of thorns.
My strategy is very conservative:
❌ Don’t chase: At 0.128, it’s basically the phase of “fooling others into buying.” Don’t be the one to catch the last baton.
✅ Key levels:
Support (watch): 0.110–0.115. If the pullback can hold steady here, it suggests there may still be a chance—consider a small position to gamble on a rebound.
Resistance (escape): 0.140–0.150. If it can’t break through the dense prior trading area, then decisively get out—don’t get greedy.
Stop-loss: A break below 0.105. If the trend is ruined, don’t daydream—run!
👉 One sentence: the aggressive folks go long right away… while the cautious ones wait for a pullback….
Many people ask me whether 0.128 is worth chasing. I didn’t answer directly—I just threw these two candlestick charts at them.
👉 A typical “oversold rebound meets resistance”: Looking at the 4-hour chart, it has been drifting down from the high at 0.269 all the way—cut in half, then cut in half again—now it has rebounded to 0.128. What does this mean? It means 0.128 is exactly the bottom of the platform during the previous leg down. And the current price is right up against the “ceiling.” There’s a huge amount of trapped positions accumulated here. If the main force wants to break through, they’ll have to spend real money to liberate the people above. Do you think they’ll be so kind as to just pull straight through? Most likely, it’s a bull trap.
👉 Short-term sentiment is overheated: The 1-hour chart shows that after a sudden spike upward, the upper wicks have started to get longer. This indicates the sell pressure overhead is extremely heavy, and the bulls’ momentum is already fading. At 0.128, it looks like a reversal, but in reality it’s a risk zone for a “double top” or a continuation of the downtrend.
This is exactly the kind of “tail-end/last-temptation” market—or a bull-trap scenario. Little meat, lots of thorns.
My strategy is very conservative:
❌ Don’t chase: At 0.128, it’s basically the phase of “fooling others into buying.” Don’t be the one to catch the last baton.
✅ Key levels:
Support (watch): 0.110–0.115. If the pullback can hold steady here, it suggests there may still be a chance—consider a small position to gamble on a rebound.
Resistance (escape): 0.140–0.150. If it can’t break through the dense prior trading area, then decisively get out—don’t get greedy.
Stop-loss: A break below 0.105. If the trend is ruined, don’t daydream—run!
👉 One sentence: the aggressive folks go long right away… while the cautious ones wait for a pullback….