Don’t get fooled by this $BTC rally! The real “drama” around 84,500 is only just beginning!
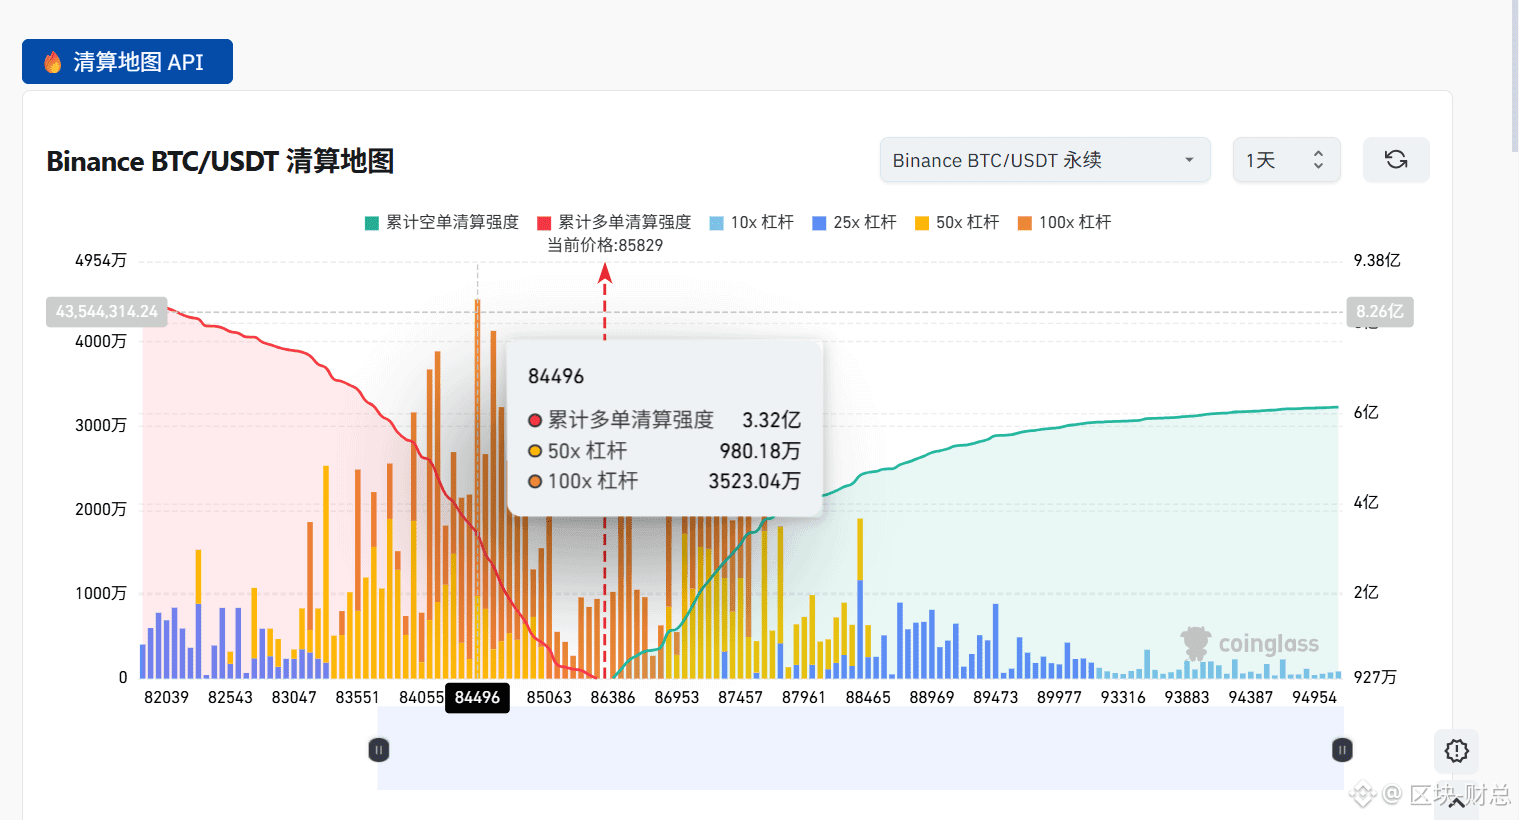
Family, after looking at this liquidation chart, my first reaction isn’t to chase the rally—it’s to watch the battle in the 84,000–86,000 zone.
As you can see on the chart, around 84.496k there’s a clear concentration of high-leverage liquidation stacks, especially资金 with 50x and 100x leverage, which are heavily clustered there. Right now BTC is roughly around 85.8k, and the price is just sitting above this liquidity area.
And after BTC’s rapid surge recently, short liquidations have clearly expanded. Latest data shows that in Binance’s past 24 hours of BTC liquidations, short positions account for about 91.5%, meaning this round of上涨 has already swept out a lot of counter-trend shorts.
So what I care about most isn’t the four words “up or down,” but whether the main players will continue to eat up liquidity next.
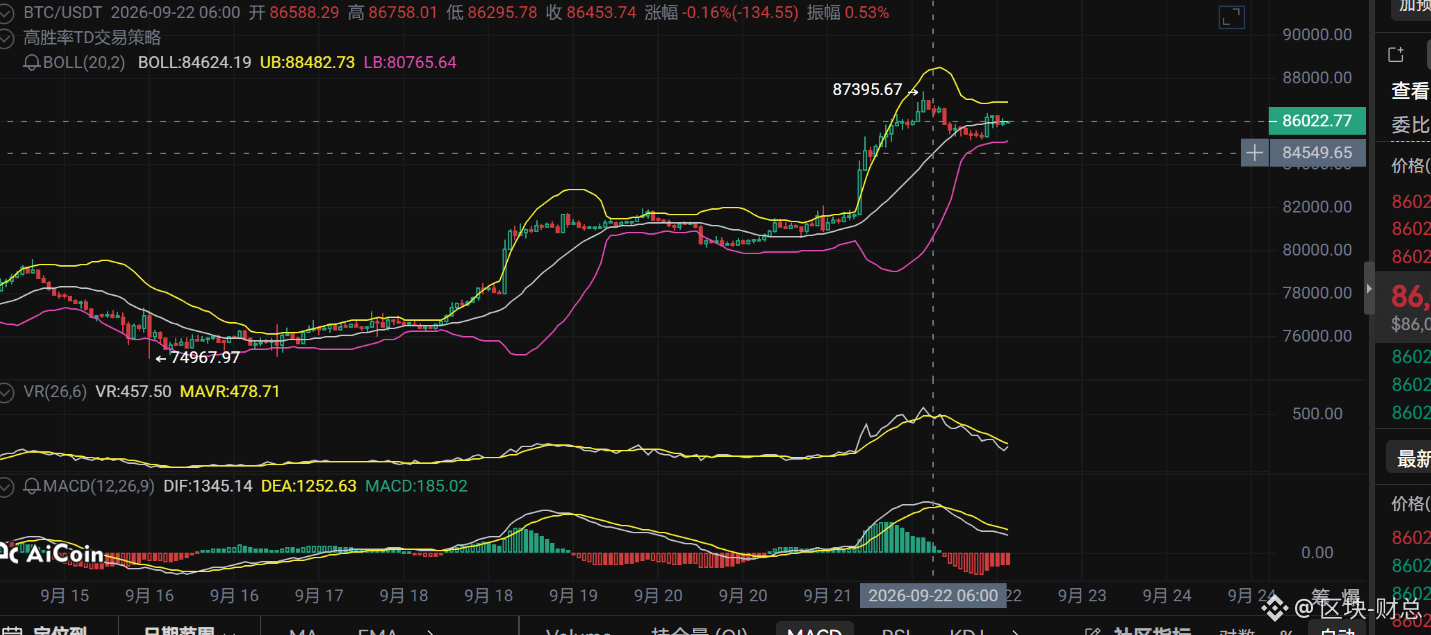
My trading logic is very simple: if 84.5k holds, the market still has room to probe higher; but if it breaks down and keeps coming under pressure, you need to guard against high-level funds flipping to the other side.
I’ve been doing $BTC for so long—what I hate most is seeing one big bullish candle and mindlessly chasing. What’s truly worth doing is usually waiting for price confirmation after a dense liquidation zone appears.
The “meat” is already laid out on the chart now, but whether we go long or short comes down to the next needle prick.
For tonight, I’ve already broken my plan down. Anyone who really understands liquidation charts should know what I’m waiting for.
If you want to know exactly how I’m watching this level and how I’m setting the entry/exit logic, come chat with me.
Before the next K-line prints, I’ll only leave you with one suspense: 84.5k—will it be the launch point for BTC’s next move, or the final trap to lure longs?
#BTC走势分析
#币圈生存法则
Family, after looking at this liquidation chart, my first reaction isn’t to chase the rally—it’s to watch the battle in the 84,000–86,000 zone.
As you can see on the chart, around 84.496k there’s a clear concentration of high-leverage liquidation stacks, especially资金 with 50x and 100x leverage, which are heavily clustered there. Right now BTC is roughly around 85.8k, and the price is just sitting above this liquidity area.
And after BTC’s rapid surge recently, short liquidations have clearly expanded. Latest data shows that in Binance’s past 24 hours of BTC liquidations, short positions account for about 91.5%, meaning this round of上涨 has already swept out a lot of counter-trend shorts.
So what I care about most isn’t the four words “up or down,” but whether the main players will continue to eat up liquidity next.
My trading logic is very simple: if 84.5k holds, the market still has room to probe higher; but if it breaks down and keeps coming under pressure, you need to guard against high-level funds flipping to the other side.
I’ve been doing $BTC for so long—what I hate most is seeing one big bullish candle and mindlessly chasing. What’s truly worth doing is usually waiting for price confirmation after a dense liquidation zone appears.
The “meat” is already laid out on the chart now, but whether we go long or short comes down to the next needle prick.
For tonight, I’ve already broken my plan down. Anyone who really understands liquidation charts should know what I’m waiting for.
If you want to know exactly how I’m watching this level and how I’m setting the entry/exit logic, come chat with me.
Before the next K-line prints, I’ll only leave you with one suspense: 84.5k—will it be the launch point for BTC’s next move, or the final trap to lure longs?
#BTC走势分析
#币圈生存法则