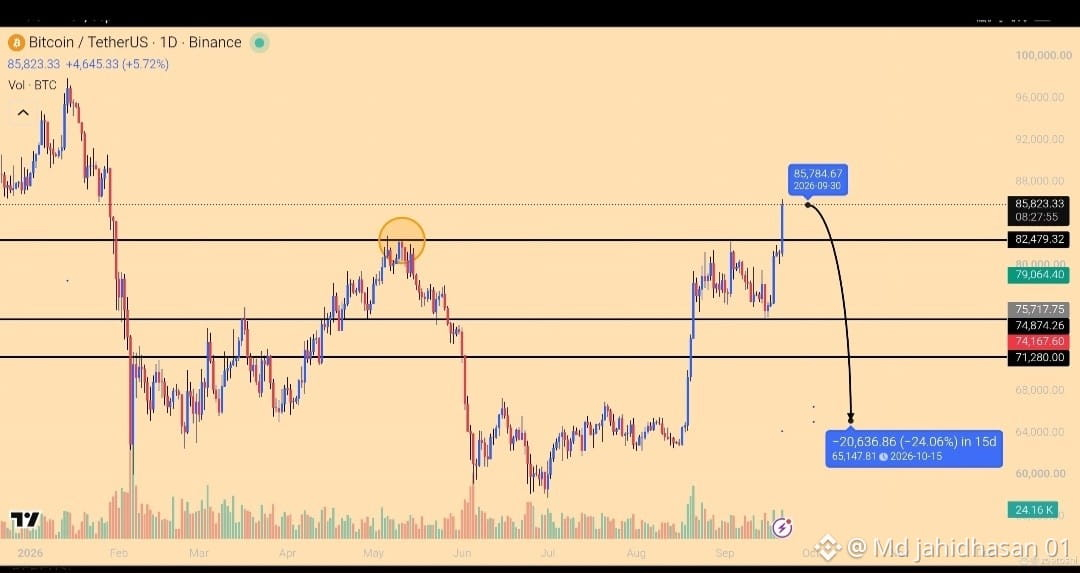
Navigating the Bitcoin markets requires a keen eye and a cool head, as this 1D Binance chart for BTC/USDT so clearly illustrates. Following a strong upward rally, we are now witnessing a classic retest scenario at a pivotal key resistance level.
💥💥💥
The yellow circle marks the point of focus where the current bullish price action is challenging the previous ceiling. While the immediate impulse might be to expect an immediate continuation of the trend, the chart is also signaling caution. The projected downward arrow, referencing a potential -24% correction, is a powerful reminder of market volatility and the omnipresent nature of risk. It suggests that a failure to decisively break above this level could lead to a significant retracement. For disciplined traders, this moment is about managing risk and preparing for either scenario, not just chasing profits. Remember, a confirmed breakout requires significant volume and sustained pressure. Let's see if this resistance will become the new support, or if a deeper correction is on the cards. Stay vigilant, stay disciplined, and manage your capital.
💥💥💥
#BTC☀️ #BNB走势 #ETH大涨
$NVDAB $NVDA.US
💥💥💥
The yellow circle marks the point of focus where the current bullish price action is challenging the previous ceiling. While the immediate impulse might be to expect an immediate continuation of the trend, the chart is also signaling caution. The projected downward arrow, referencing a potential -24% correction, is a powerful reminder of market volatility and the omnipresent nature of risk. It suggests that a failure to decisively break above this level could lead to a significant retracement. For disciplined traders, this moment is about managing risk and preparing for either scenario, not just chasing profits. Remember, a confirmed breakout requires significant volume and sustained pressure. Let's see if this resistance will become the new support, or if a deeper correction is on the cards. Stay vigilant, stay disciplined, and manage your capital.
💥💥💥
#BTC☀️ #BNB走势 #ETH大涨
$NVDAB $NVDA.US