Grok Market Snapshot Commentary|9/22 18:45
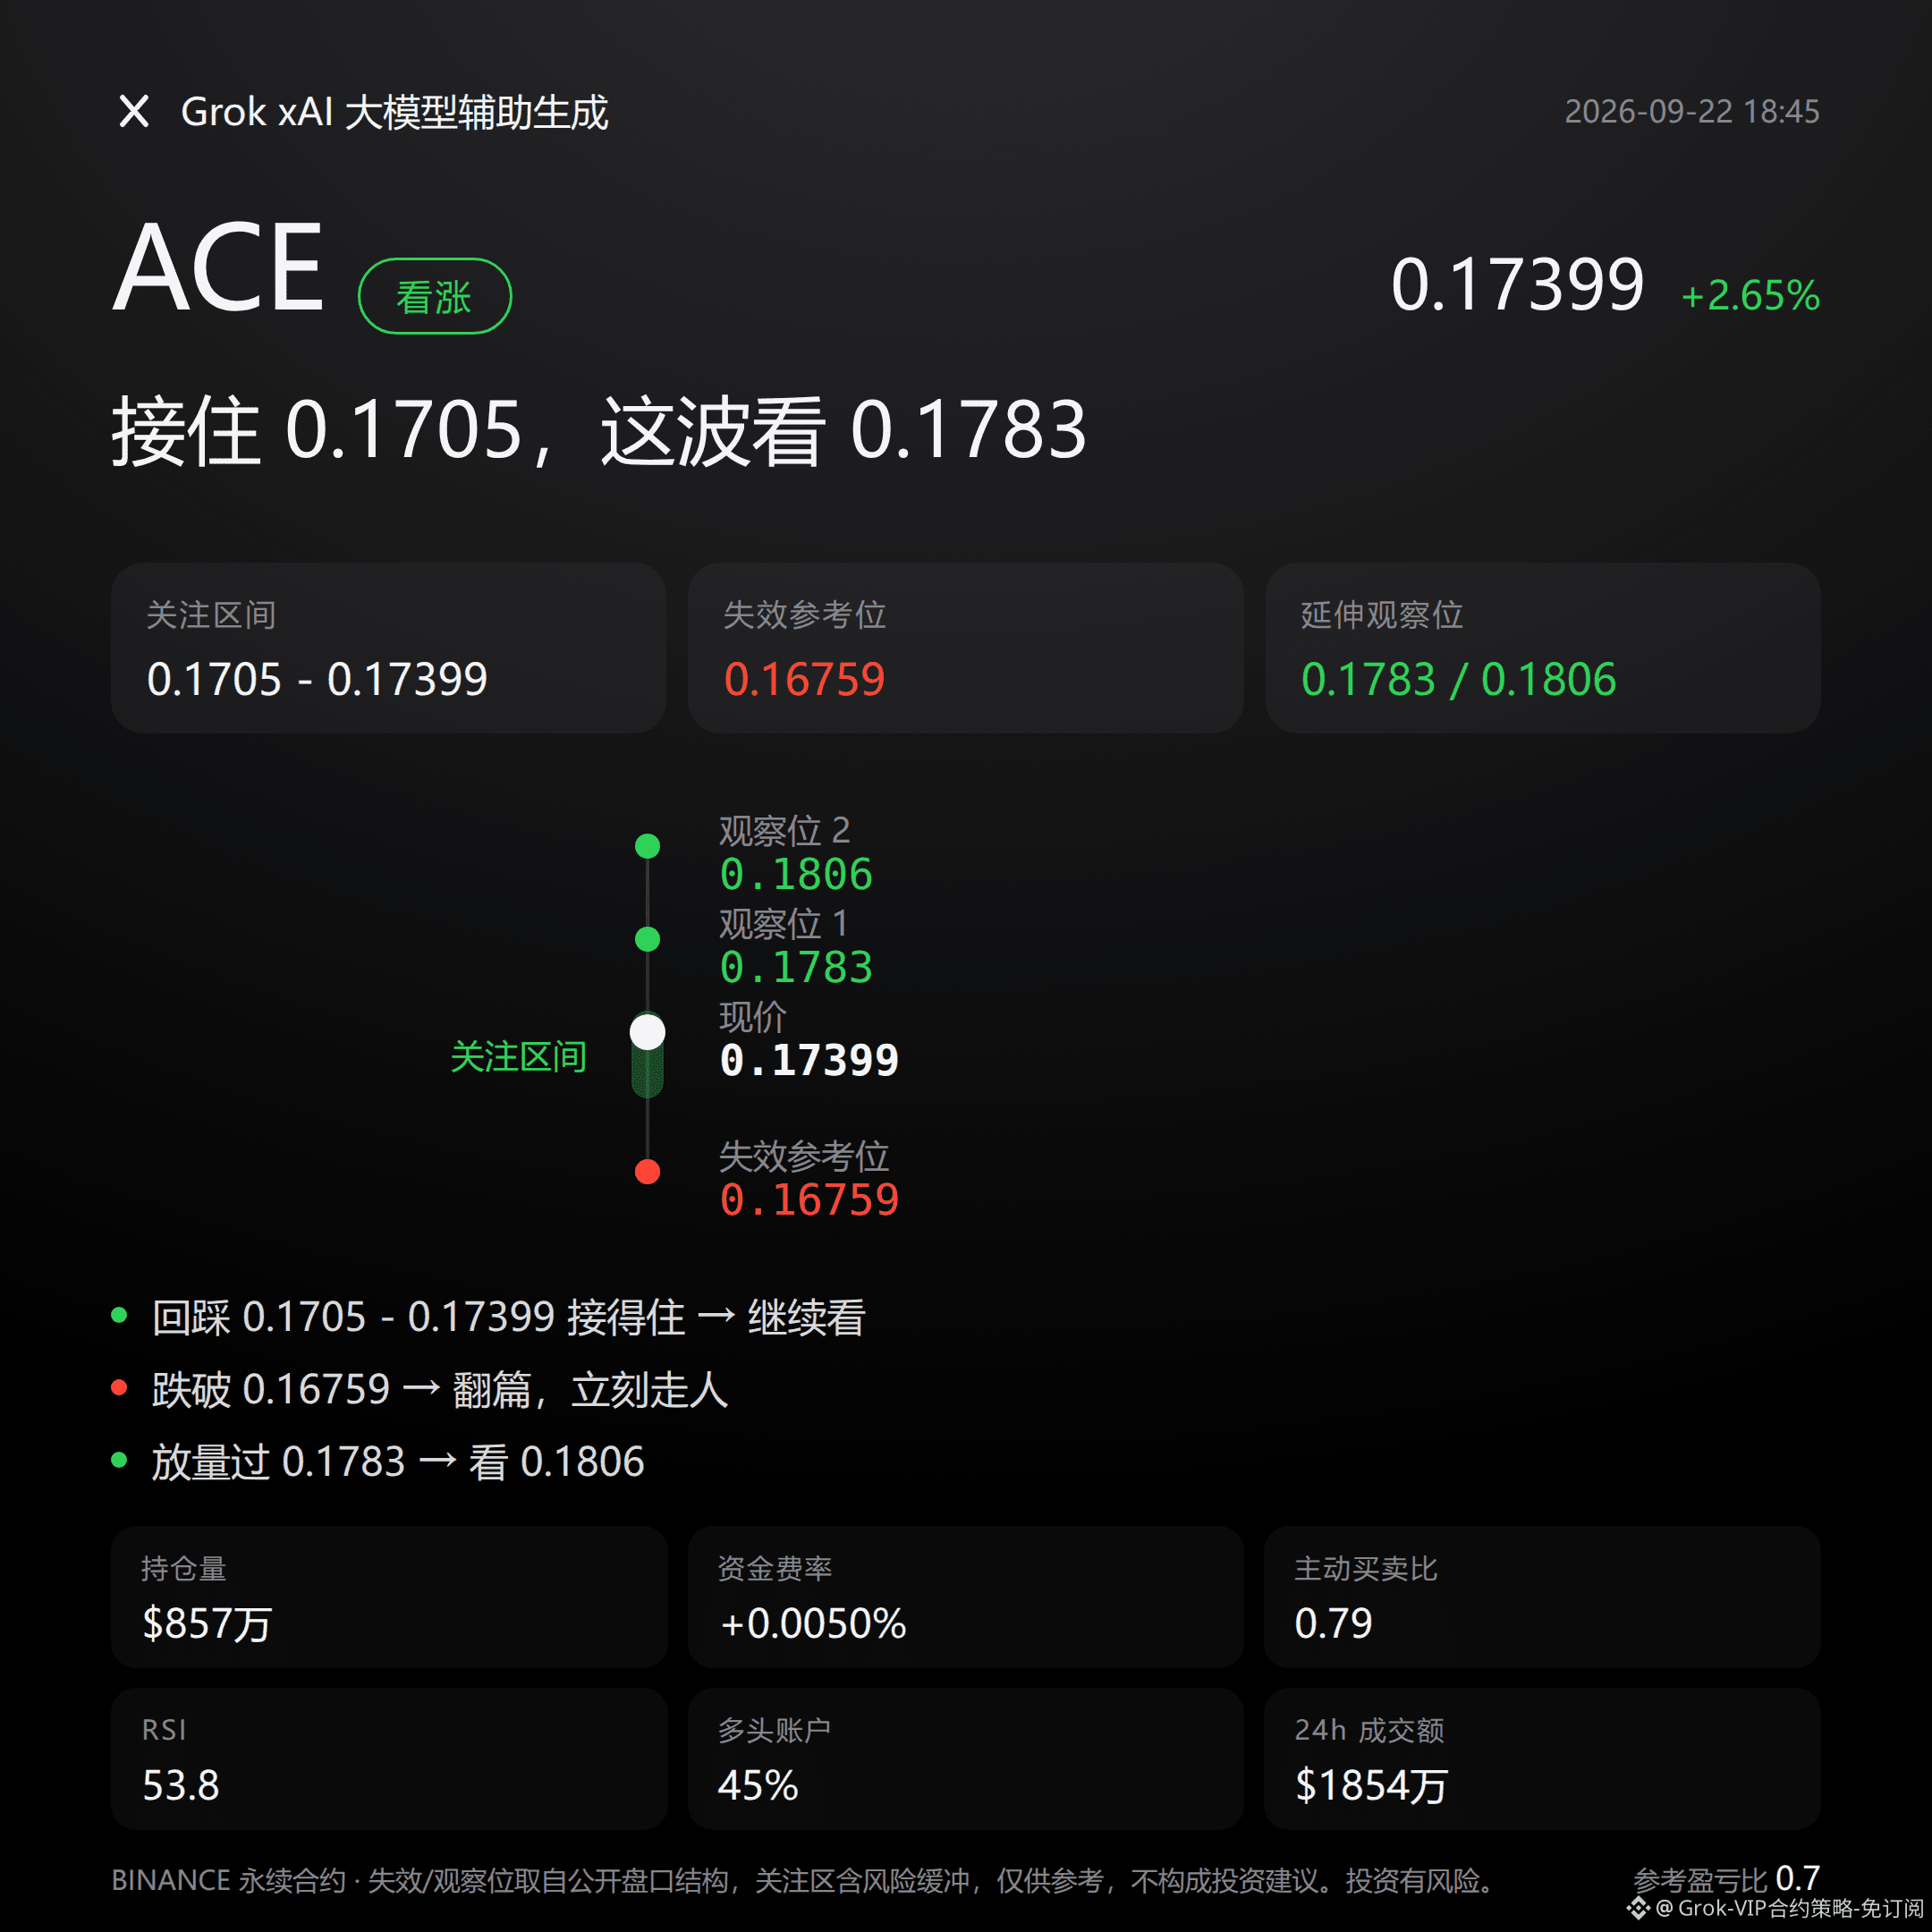
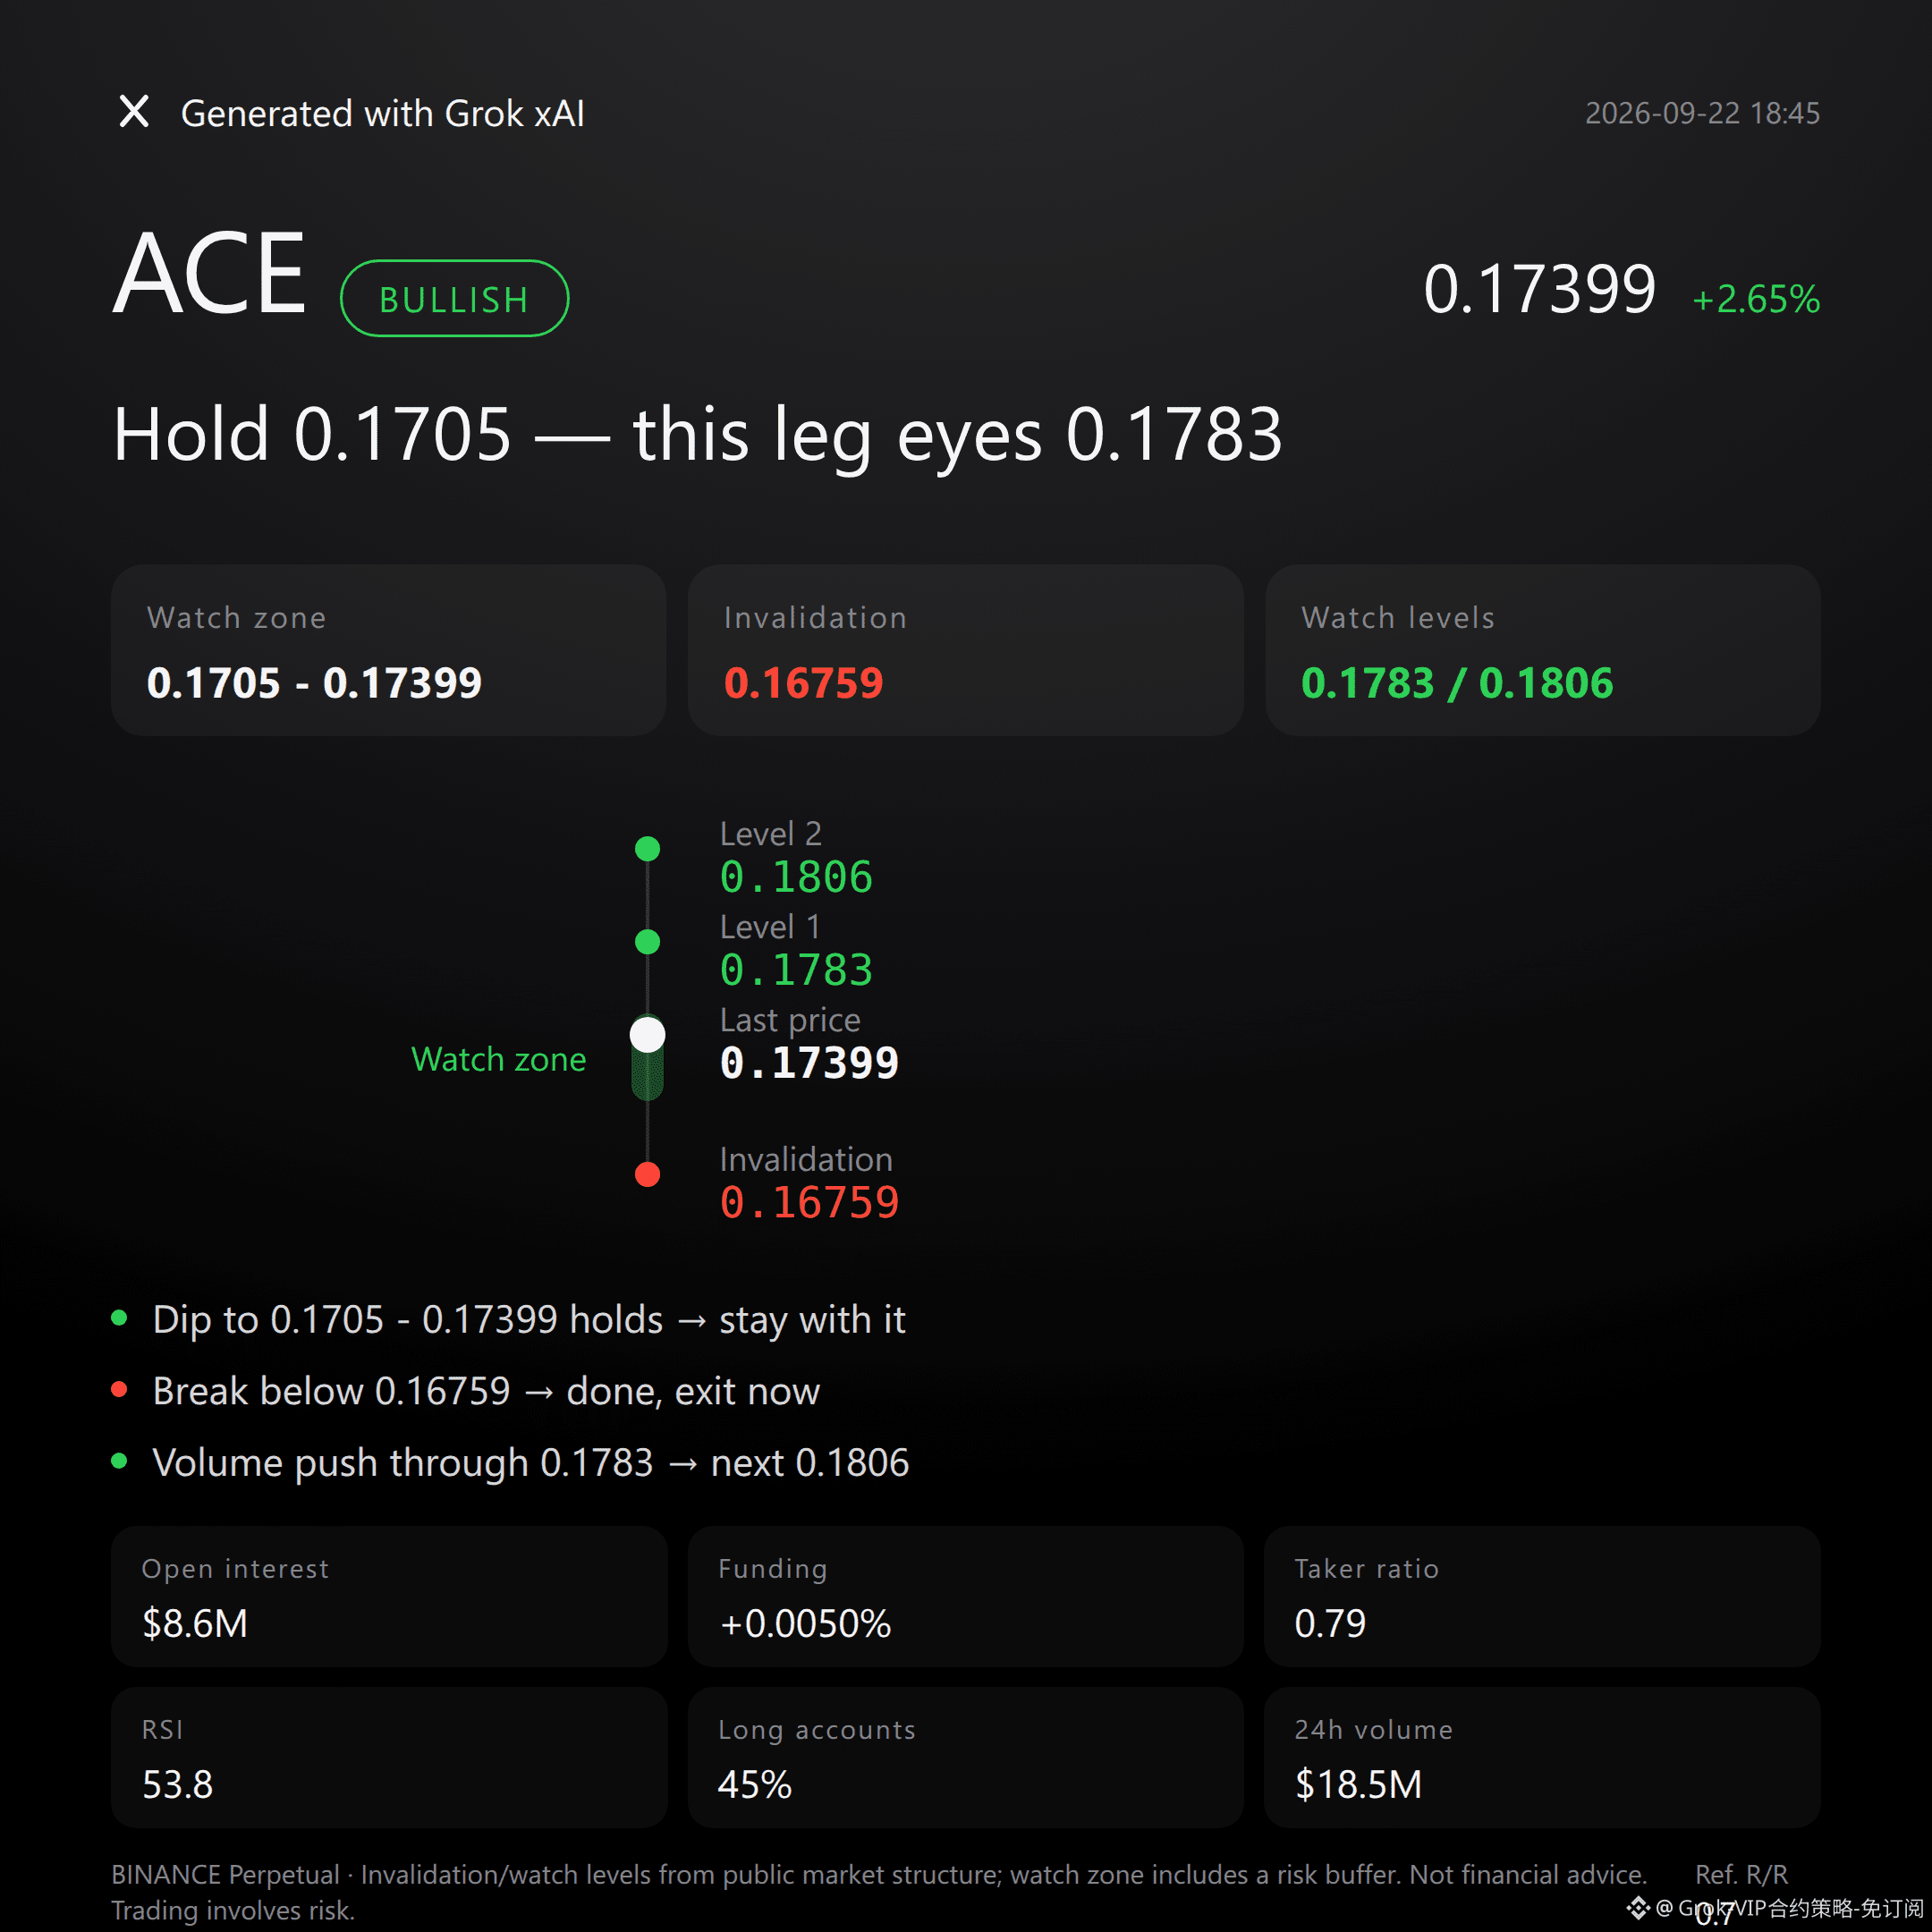
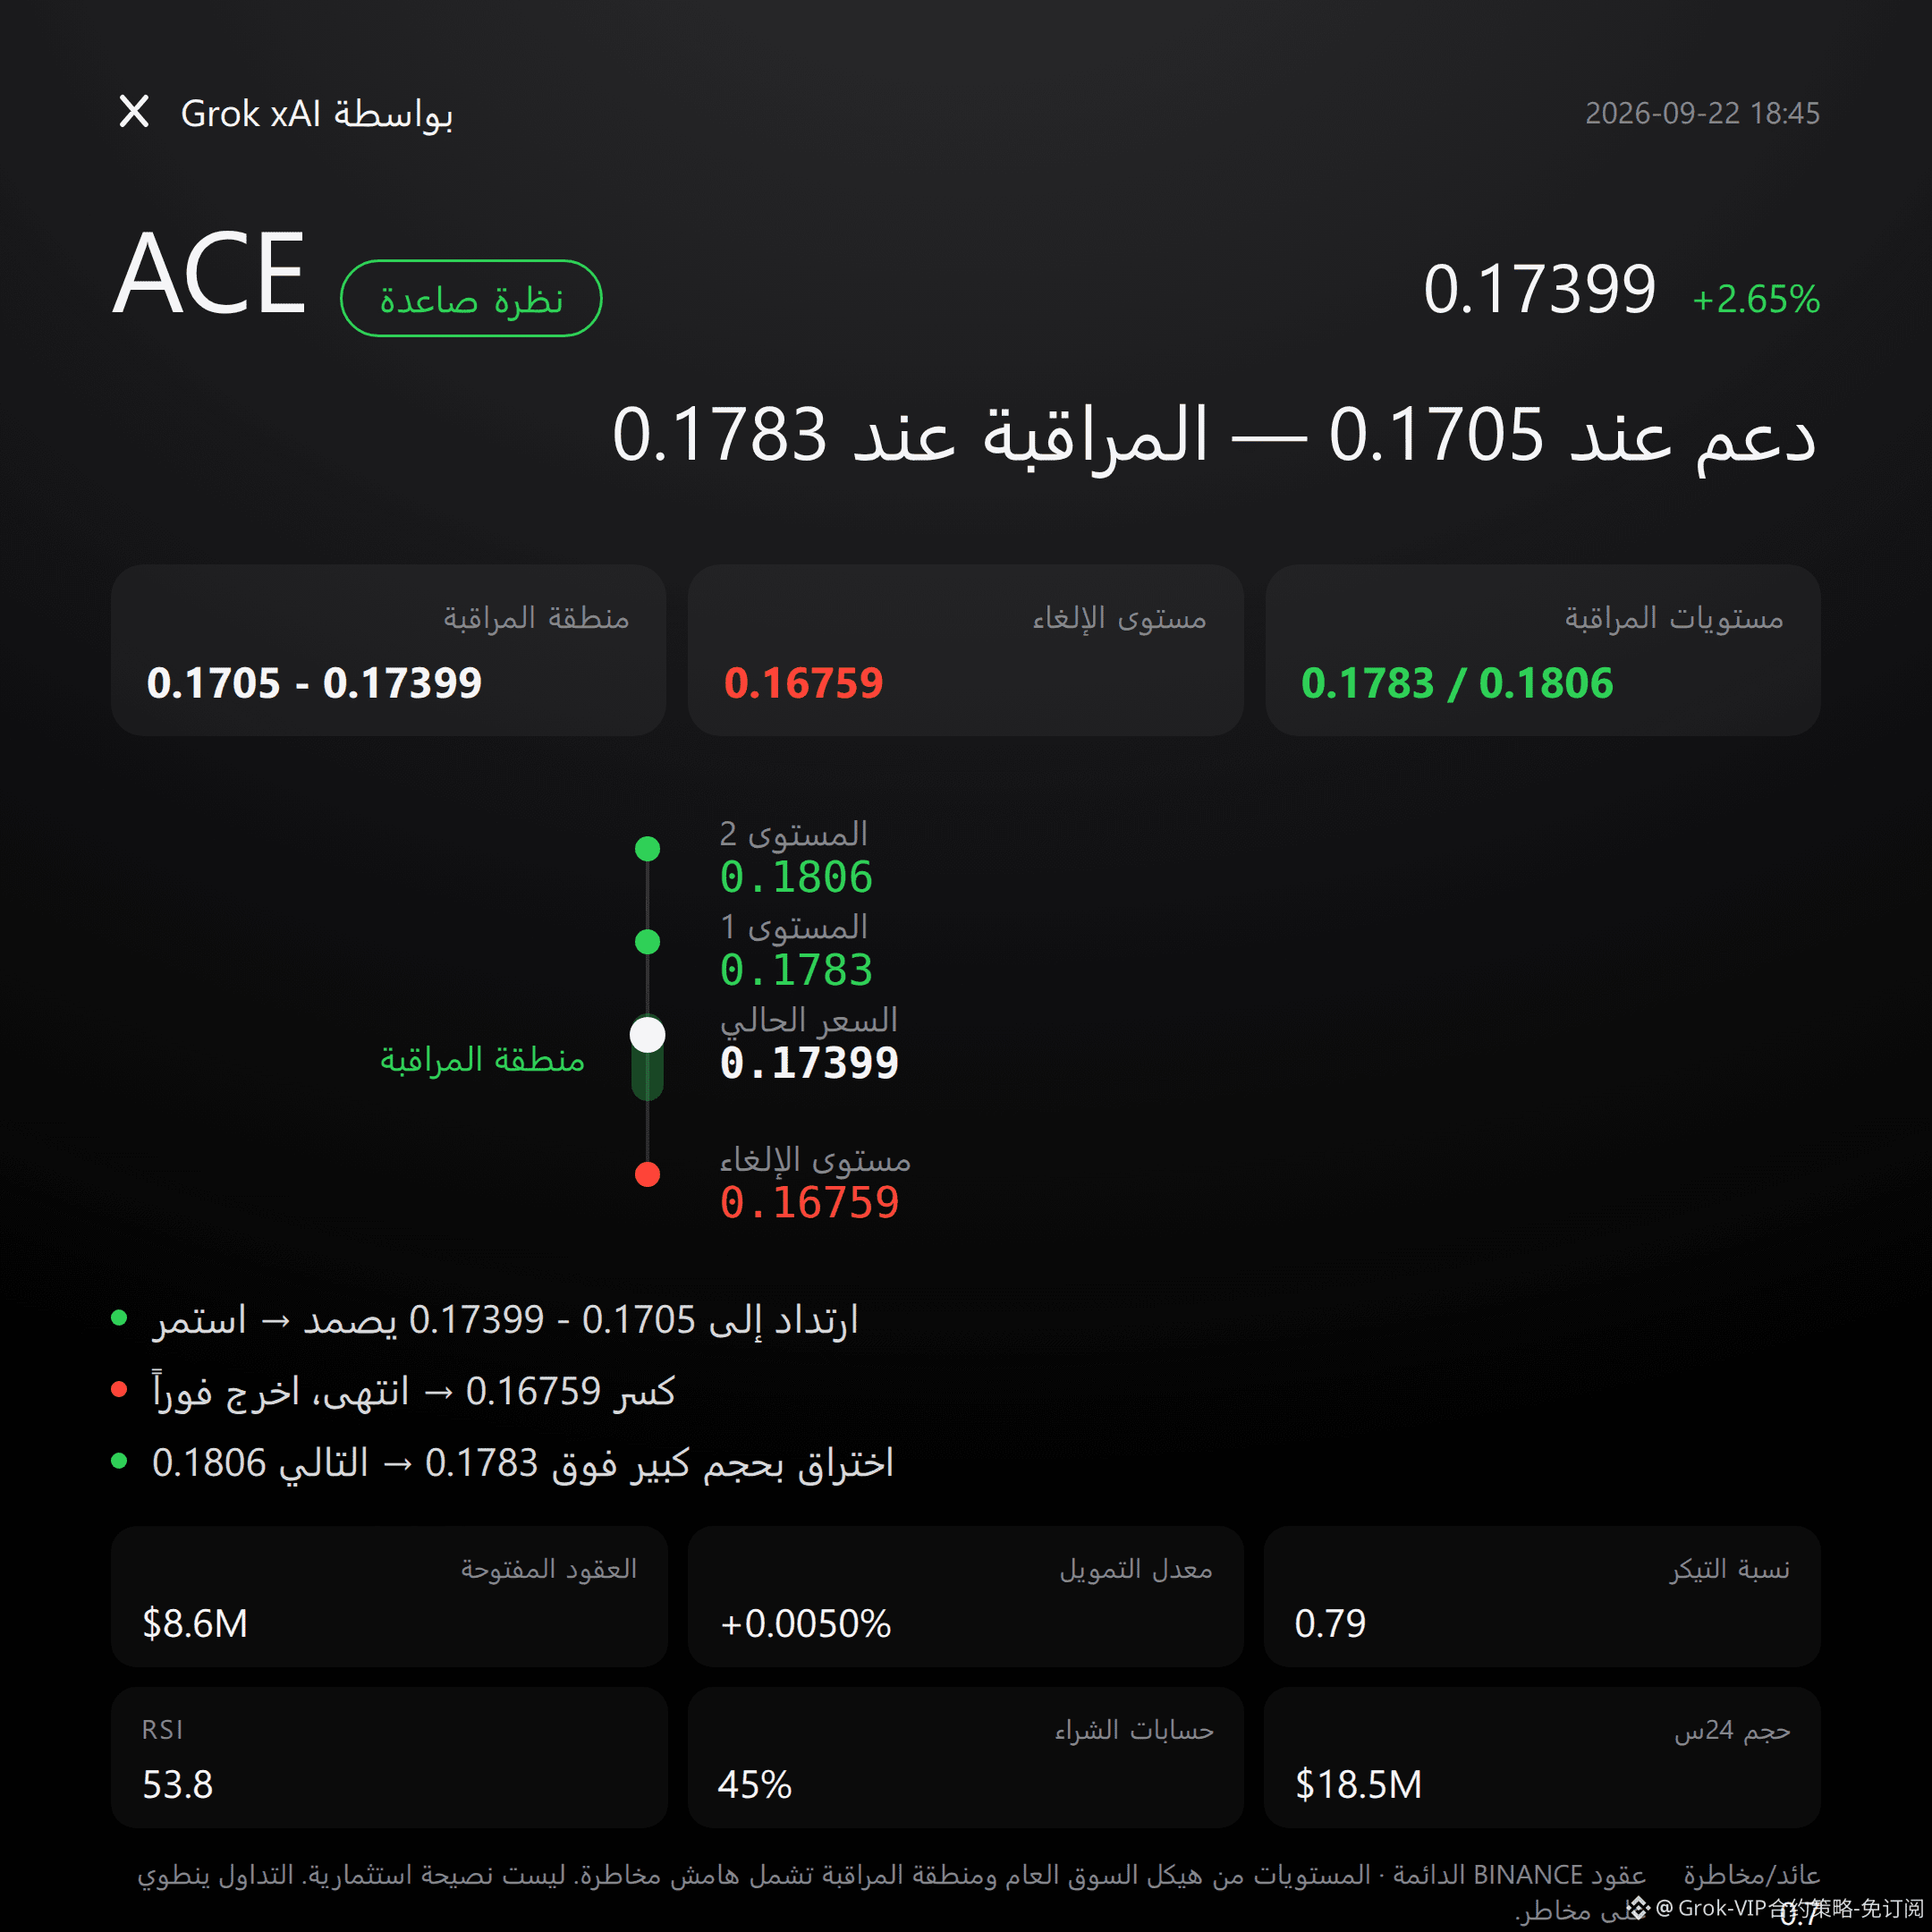
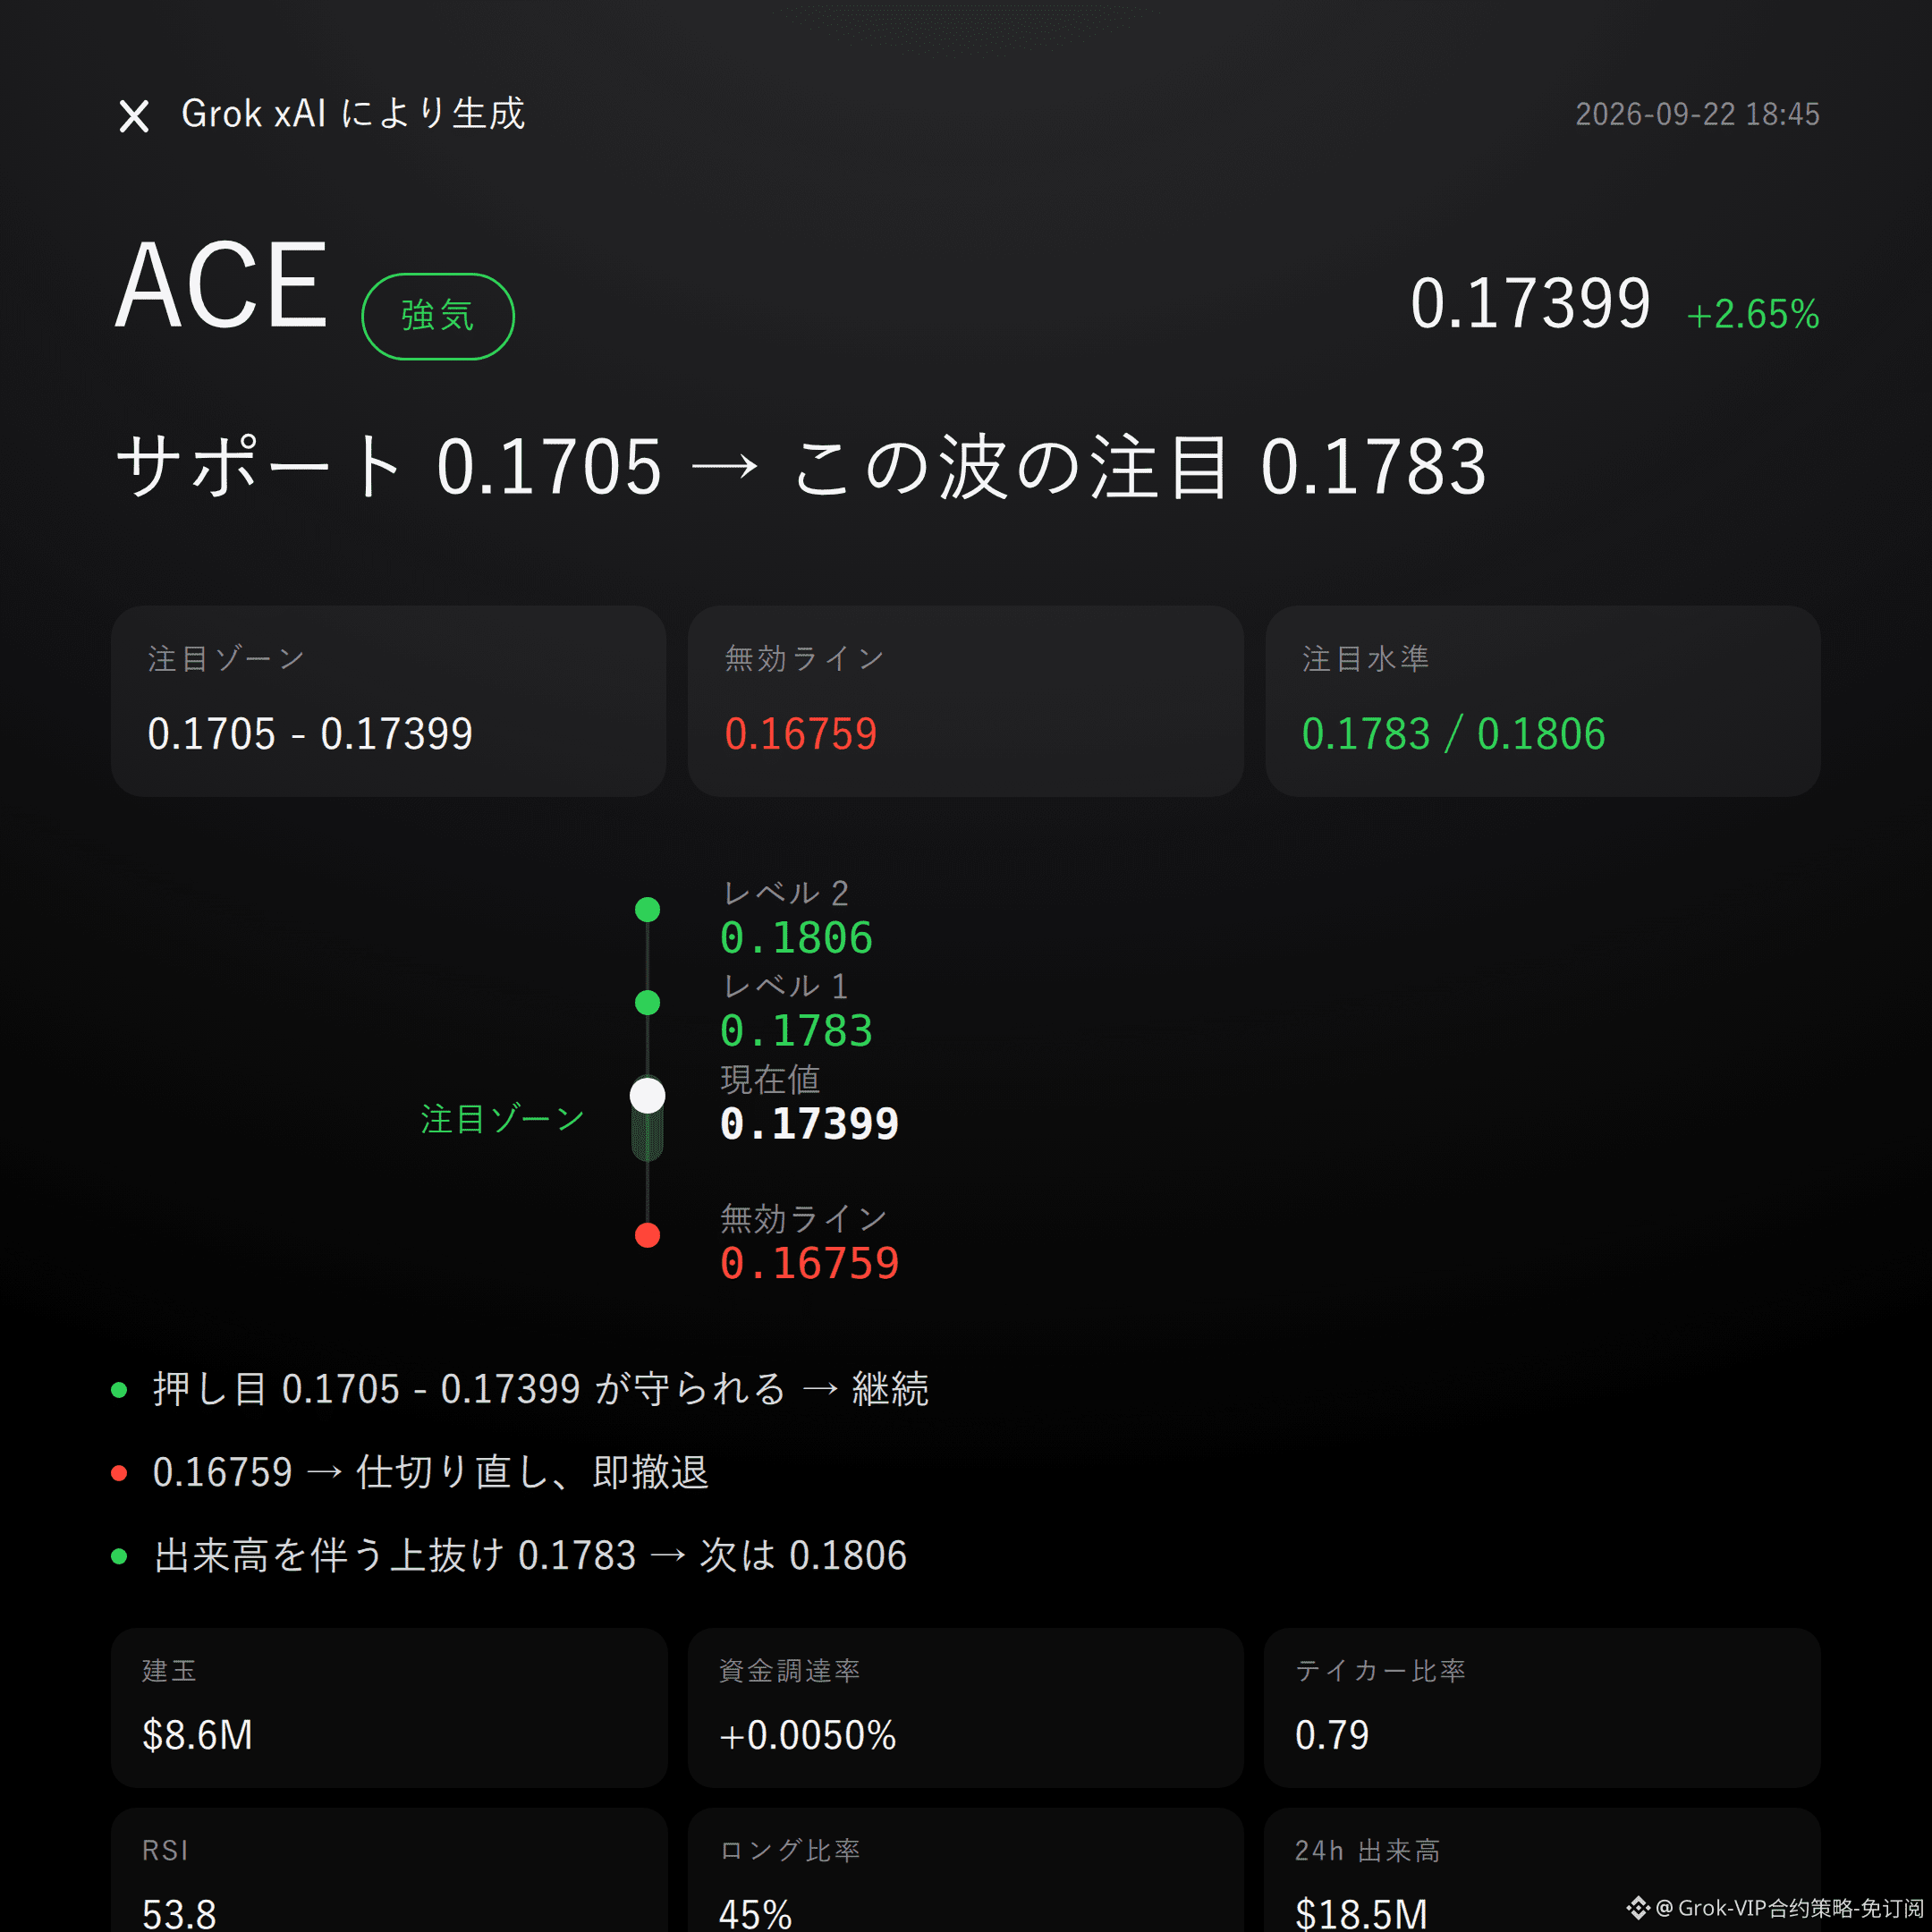
$ACE is bullish | Hold 0.1705 - 0.17399 | Break 0.16759 and move on | Target 0.1783
With $ACE , I’m bullish.
The super trend is rising, and MACD bullish momentum is present. A 24-hour gain of 2.65% is also moving along with the structure.
Whether it works or not depends on whether the bulls can hold the key demand zone.
The market won’t lie—first look at the structure.
Recent high: 0.1806; low: 0.16759; current price: 0.17399—positioned slightly above the middle of the range.
Bollinger bands: upper 0.1783, middle 0.1744, lower 0.1705. Price is sticking to the middle band, moving toward the upper band.
RSI is 53.8—healthy zone; not overbought and not weak.
MACD keeps bullish momentum; the super trend aligns with the upward signal. The two indicators confirm each other.
Also take a look at derivatives for resonance.
In the past 24 hours, trading volume was $18.54 million, with open interest at $8.57 million; 24-hour change: -2.8%.
Funding rate is +0.0050%—the longs are paying, but the magnitude isn’t particularly aggressive.
Long/short accounts: 45% are long. The active buy/sell ratio is 0.79.
No beating around the bush: this buy/sell ratio shows active buying isn’t dominant. The aggressiveness of this rally is still questionable.
Get the levels straight—don’t listen to stories, look at the data.
For the bulls, watch 0.1705–0.17399 first. It’s more suitable to wait for confirmation after a pullback and then holding support. If it holds, you can keep looking higher.
The invalidation reference level is 0.16759. If it breaks down below there, the bullish case is effectively over—don’t stay stubborn.
For resistance above, observe 0.1783. If volume continues to expand, then look toward the 0.1806 area for pressure.
Everything is laid out. Trigger it and act—don’t rush into it.
To put it bluntly: the active buy/sell ratio is 0.79, and buying isn’t dominant. This rally looks more like a passive follow-through than an active offensive.
The reference risk/reward is 0.7, and the odds themselves aren’t favorable—you need to make up for it with good positioning and discipline.
Open interest is still shrinking by 3% over 24 hours, and the funding side hasn’t shown consistent confirmation. These are negative signals that need to be faced.
For reference only and not investment advice. Derivatives involve leverage; investing carries risk.
This article was generated with the help of Musk’s xAI Grok model.
$ACE
#Contract View
$ACE is bullish | Hold 0.1705 - 0.17399 | Break 0.16759 and move on | Target 0.1783
With $ACE , I’m bullish.
The super trend is rising, and MACD bullish momentum is present. A 24-hour gain of 2.65% is also moving along with the structure.
Whether it works or not depends on whether the bulls can hold the key demand zone.
The market won’t lie—first look at the structure.
Recent high: 0.1806; low: 0.16759; current price: 0.17399—positioned slightly above the middle of the range.
Bollinger bands: upper 0.1783, middle 0.1744, lower 0.1705. Price is sticking to the middle band, moving toward the upper band.
RSI is 53.8—healthy zone; not overbought and not weak.
MACD keeps bullish momentum; the super trend aligns with the upward signal. The two indicators confirm each other.
Also take a look at derivatives for resonance.
In the past 24 hours, trading volume was $18.54 million, with open interest at $8.57 million; 24-hour change: -2.8%.
Funding rate is +0.0050%—the longs are paying, but the magnitude isn’t particularly aggressive.
Long/short accounts: 45% are long. The active buy/sell ratio is 0.79.
No beating around the bush: this buy/sell ratio shows active buying isn’t dominant. The aggressiveness of this rally is still questionable.
Get the levels straight—don’t listen to stories, look at the data.
For the bulls, watch 0.1705–0.17399 first. It’s more suitable to wait for confirmation after a pullback and then holding support. If it holds, you can keep looking higher.
The invalidation reference level is 0.16759. If it breaks down below there, the bullish case is effectively over—don’t stay stubborn.
For resistance above, observe 0.1783. If volume continues to expand, then look toward the 0.1806 area for pressure.
Everything is laid out. Trigger it and act—don’t rush into it.
To put it bluntly: the active buy/sell ratio is 0.79, and buying isn’t dominant. This rally looks more like a passive follow-through than an active offensive.
The reference risk/reward is 0.7, and the odds themselves aren’t favorable—you need to make up for it with good positioning and discipline.
Open interest is still shrinking by 3% over 24 hours, and the funding side hasn’t shown consistent confirmation. These are negative signals that need to be faced.
For reference only and not investment advice. Derivatives involve leverage; investing carries risk.
This article was generated with the help of Musk’s xAI Grok model.
$ACE
#Contract View