📊 Current Situation
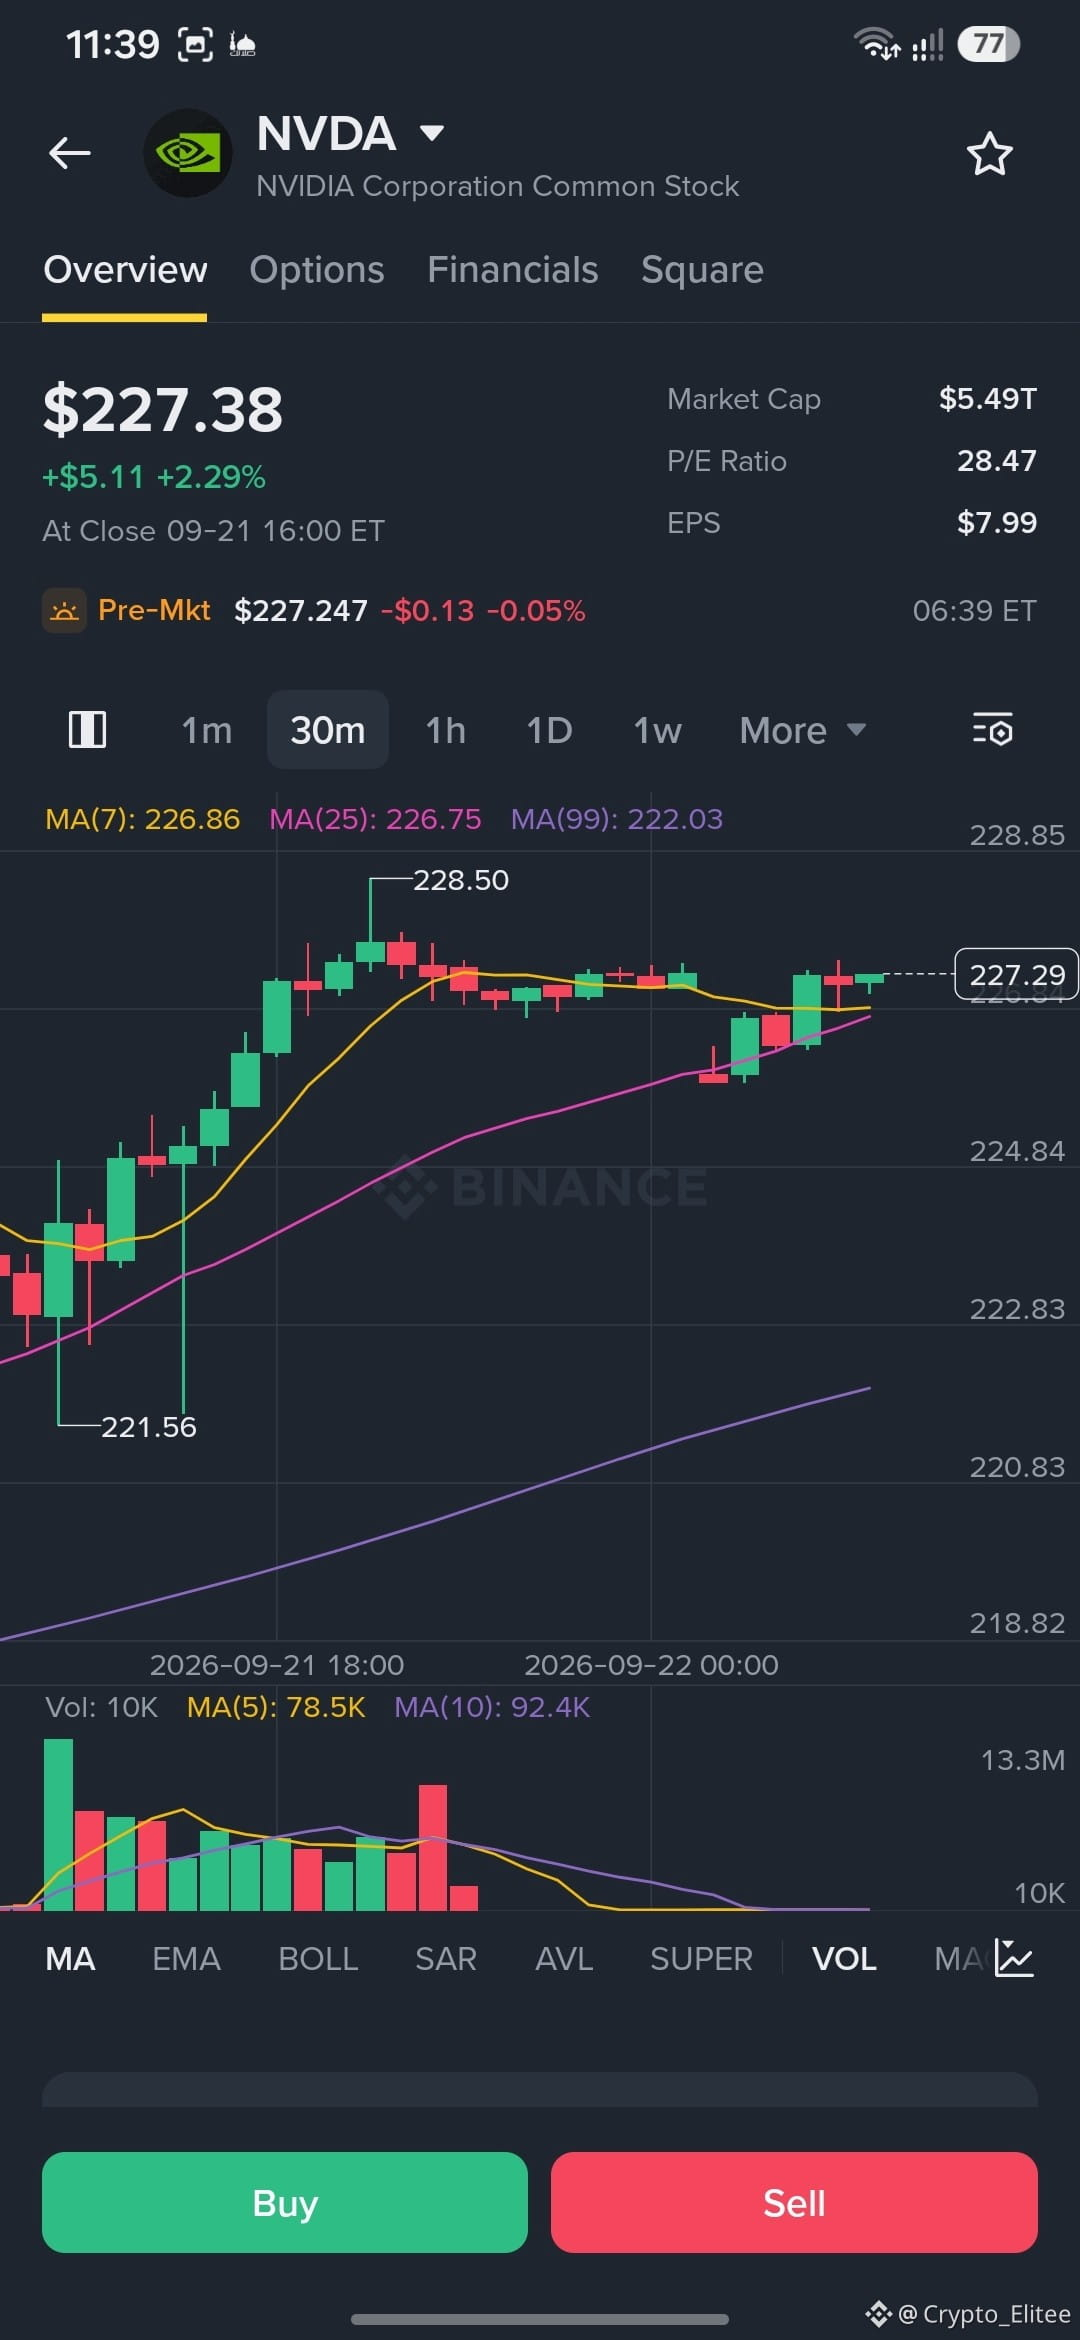
Price: $227.38
MA7: $226.86
MA25: $226.75
MA99: $222.03
Last High: $228.50
Visible Low: $221.56
The price is currently above MA7, MA25, and MA99, which gives a positive short-term structure. However, the price is very close to resistance.
🔴 Key Resistance
$228.50 is the most important level right now.
If the price breaks above it and a 30-minute candle closes above it with an increase in volume, this would be a stronger confirmation that the upward movement will continue.
Then watch the $229–230 area as a psychological zone.
🟢 Supports
$226.7–226.8 → first support, since MA7 and MA25 are very close.
$225–225.5 → important support from the last move.
$224.8 (approx.) → lower support visible on the chart.
$222 (approx.) → MA99 and stronger support.
📈 Bullish Scenario
226.7 → 228.5 ↑ breakout → 229–230
The most important thing is not just touching 228.50, but breaking above it and holding above it.
📉 Bearish Scenario
If the price fails multiple times around 228.50 and then breaks 226.7, it may return to 225 then 224.8.
A break of 224.8 would put $222 (approx.) into the test zone.
⚠️ Note on Volume
The volume in the last rebound isn’t very strong, so there isn’t a strong confirmation of breaking the high yet. It’s best to monitor 228.50 together with volume.
Technical Summary from the Chart:
🟢 Short-term trend: Bullish
🟢 Above MA7/25/99
🔴 Resistance: 228.50
🟢 Support: 226.7
🟢 Stronger support: 224.8 then 222
🎯 Key to Movement: Break above 228.50 with clear trading volume.
Price: $227.38
MA7: $226.86
MA25: $226.75
MA99: $222.03
Last High: $228.50
Visible Low: $221.56
The price is currently above MA7, MA25, and MA99, which gives a positive short-term structure. However, the price is very close to resistance.
🔴 Key Resistance
$228.50 is the most important level right now.
If the price breaks above it and a 30-minute candle closes above it with an increase in volume, this would be a stronger confirmation that the upward movement will continue.
Then watch the $229–230 area as a psychological zone.
🟢 Supports
$226.7–226.8 → first support, since MA7 and MA25 are very close.
$225–225.5 → important support from the last move.
$224.8 (approx.) → lower support visible on the chart.
$222 (approx.) → MA99 and stronger support.
📈 Bullish Scenario
226.7 → 228.5 ↑ breakout → 229–230
The most important thing is not just touching 228.50, but breaking above it and holding above it.
📉 Bearish Scenario
If the price fails multiple times around 228.50 and then breaks 226.7, it may return to 225 then 224.8.
A break of 224.8 would put $222 (approx.) into the test zone.
⚠️ Note on Volume
The volume in the last rebound isn’t very strong, so there isn’t a strong confirmation of breaking the high yet. It’s best to monitor 228.50 together with volume.
Technical Summary from the Chart:
🟢 Short-term trend: Bullish
🟢 Above MA7/25/99
🔴 Resistance: 228.50
🟢 Support: 226.7
🟢 Stronger support: 224.8 then 222
🎯 Key to Movement: Break above 228.50 with clear trading volume.