📊 Current Situation
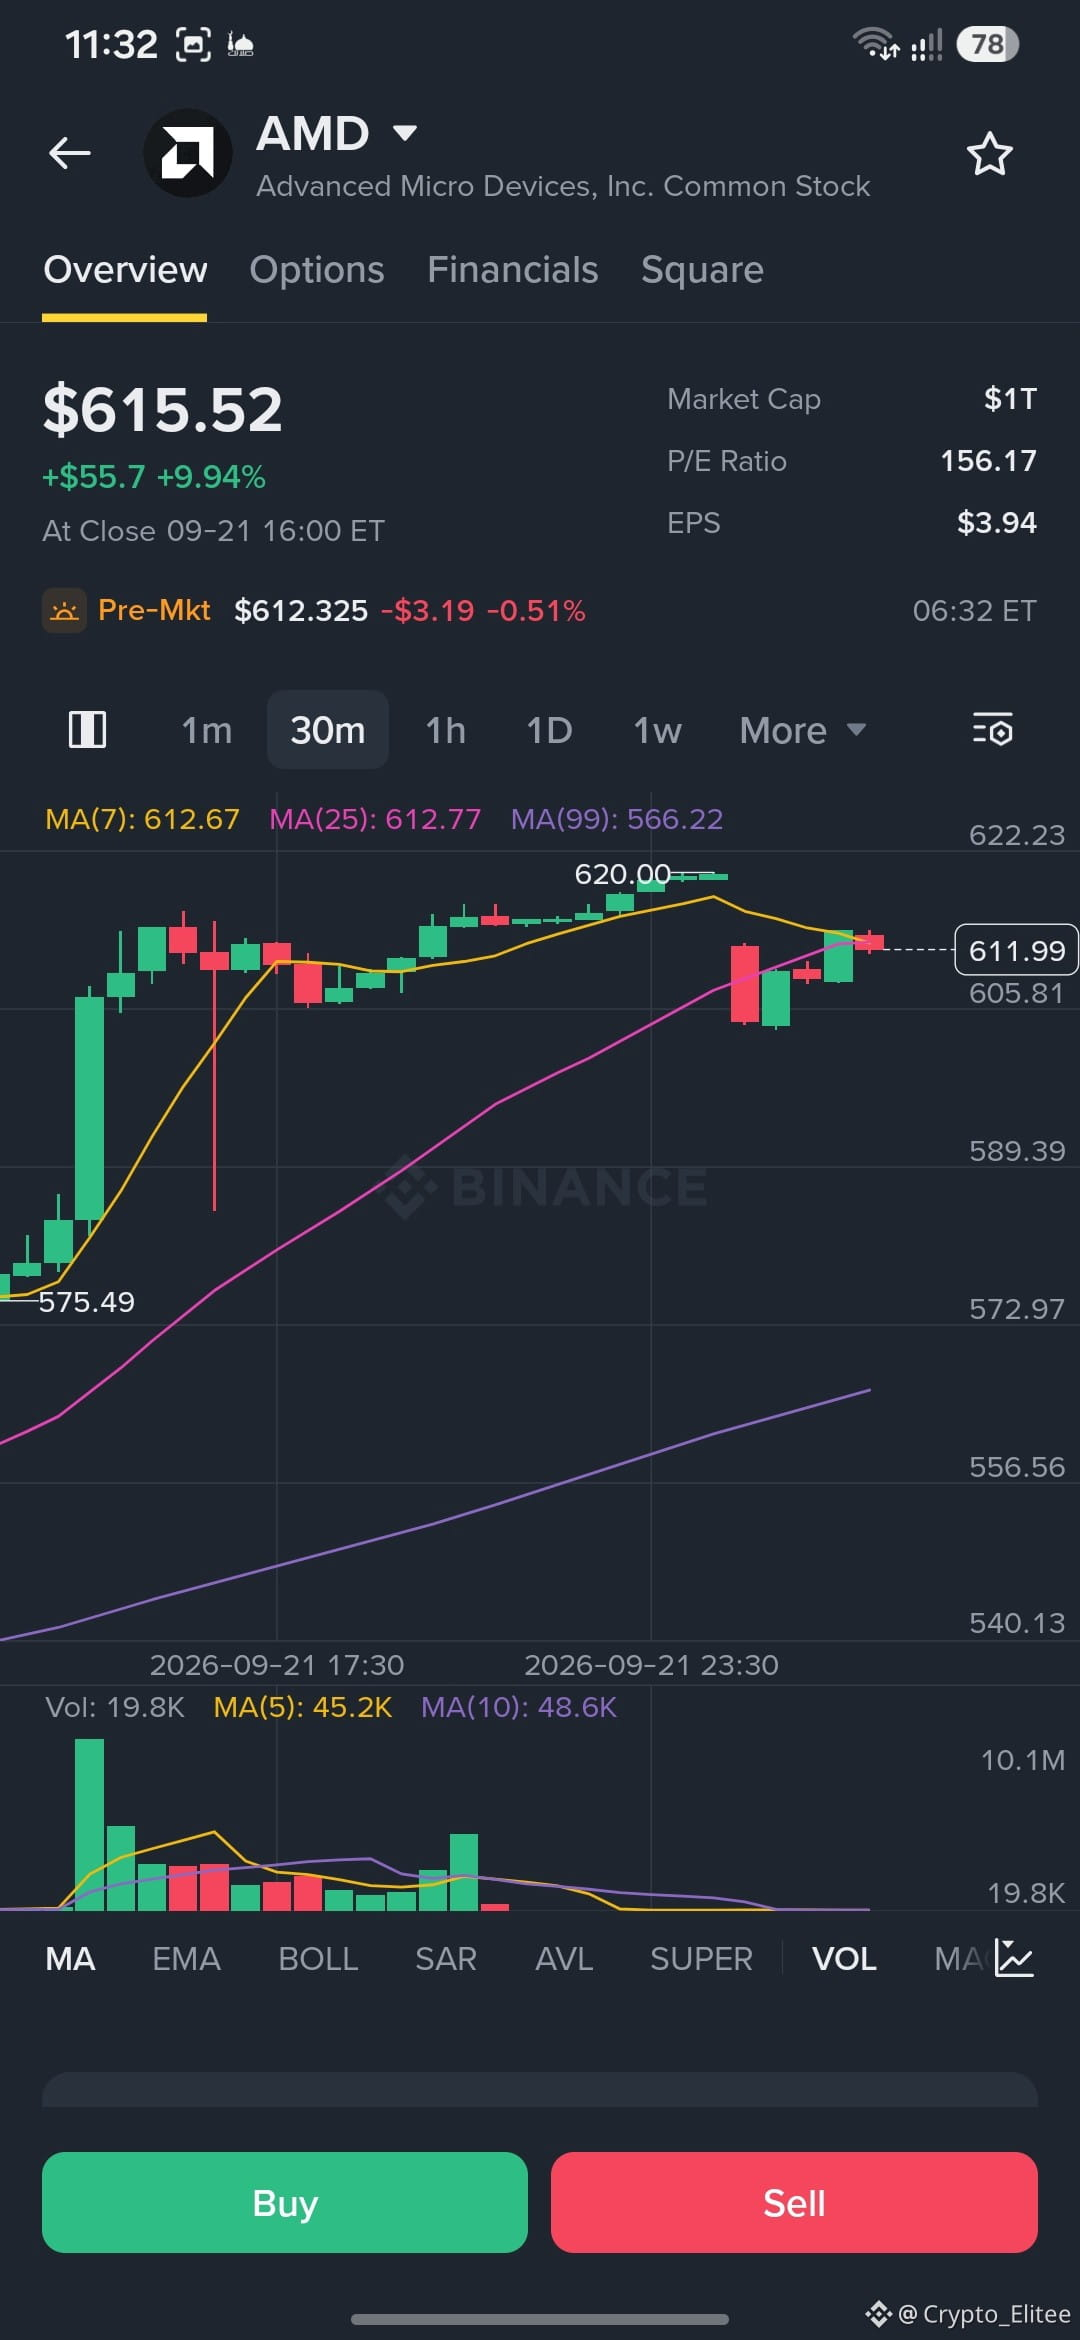
Displayed Price: $615.52
Price Before Opening: $612.33
Last High: $620.00
Visible Low: $575.49
MA7: 612.67
MA25: 612.77
MA99: 566.22
The price is very close to MA7 and MA25, meaning the current area is a decision zone after a strong rise.
🟢 Resistances
$620 → The most important resistance level right now.
If there is a clear breakout above 620 with good trading volume, the next level on the chart is about:
$622–625
Then you can monitor further upside extension if momentum continues.
🔴 Supports
$612–610 → An important short-term support zone.
$605–606 → Stronger support, close to the last pullback area.
$595–600 → A psychological and technical support.
~$566 → MA99, but it’s currently far.
📈 Bullish Scenario
If AMD holds 610–612 and then breaks 620 with a 30-minute candle close above it and high volume, this confirms that buyers are still in control in the short term.
📉 Bearish Scenario
If it fails to break above 620 and then breaks 610, it may return to test 605–606.
Breaking this zone makes 600, then 595, areas to watch.
⚠️ Very Important Point
The move from 575 → 620 was very strong, while the most recent candles became small and near the top, with a clear decline in volume. So I don’t consider 620 broken yet; I need a real breakout and consolidation above it, not just a touch.
Technical Summary:
575 ↑ 600 ↑ 612 → 620
Currently: 612 is support / 620 is resistance. Breaking either one is what provides the clearest short-term direction.
Displayed Price: $615.52
Price Before Opening: $612.33
Last High: $620.00
Visible Low: $575.49
MA7: 612.67
MA25: 612.77
MA99: 566.22
The price is very close to MA7 and MA25, meaning the current area is a decision zone after a strong rise.
🟢 Resistances
$620 → The most important resistance level right now.
If there is a clear breakout above 620 with good trading volume, the next level on the chart is about:
$622–625
Then you can monitor further upside extension if momentum continues.
🔴 Supports
$612–610 → An important short-term support zone.
$605–606 → Stronger support, close to the last pullback area.
$595–600 → A psychological and technical support.
~$566 → MA99, but it’s currently far.
📈 Bullish Scenario
If AMD holds 610–612 and then breaks 620 with a 30-minute candle close above it and high volume, this confirms that buyers are still in control in the short term.
📉 Bearish Scenario
If it fails to break above 620 and then breaks 610, it may return to test 605–606.
Breaking this zone makes 600, then 595, areas to watch.
⚠️ Very Important Point
The move from 575 → 620 was very strong, while the most recent candles became small and near the top, with a clear decline in volume. So I don’t consider 620 broken yet; I need a real breakout and consolidation above it, not just a touch.
Technical Summary:
575 ↑ 600 ↑ 612 → 620
Currently: 612 is support / 620 is resistance. Breaking either one is what provides the clearest short-term direction.